Fig. 6.

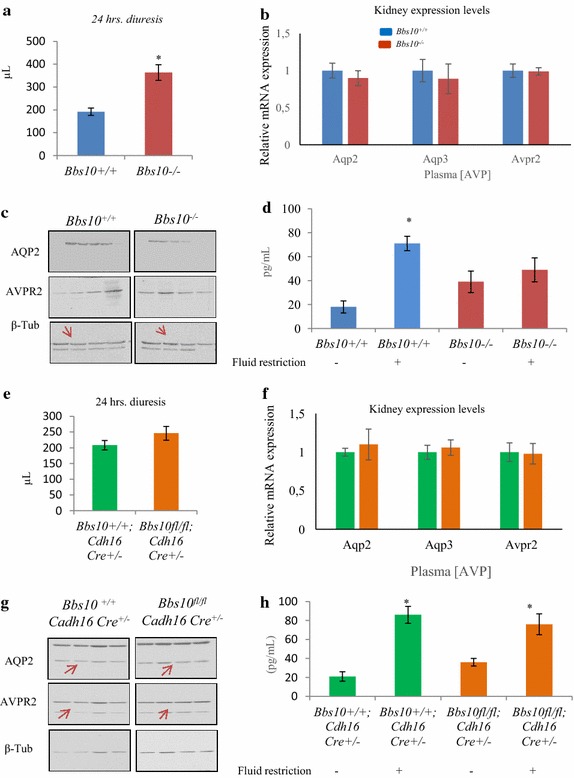
Bbs10−/− mice but not Bbs10 fl/fl ; Cadh16-Cre +/− mice display polyuria associated with increased circulating AVP concentrations. a Urinary volume (µL) under 24-h fluid deprivation of Bbs10 +/+ and Bbs10 −/− mice (n = 6 per genotype). b Relative mRNA expression levels of Aqp2, Aqp3 and Avpr2 in Bbs10 +/+ and Bbs10 −/− kidneys. Gene of reference Gapdh. c Entire photographs of immunoblots for AQP2, AVPR2 and β-tub in kidneys of Bbs10 +/+ and Bbs10 −/−. d AVP plasma levels in Bbs10 +/+ and Bbs10 −/− under 24-h fluid restriction or in normal conditions. (n = 5 per genotype). e Urinary volume (µL) under 24-h fluid deprivation of Bbs10 fl/fl ; Cadh16Cre +/− and control Bbs10 +/+ ; Cadh16Cre +/− littermates (n = 6 per genotype). f Relative mRNA expression levels of Aqp2, Aqp3 and Avpr2 in Bbs10 +/+ ; Cadh16Cre +/− and Bbs10 fl/fl ; Cadh16Cre +/−. g Entire photographs of the immunoblots for AQP2, AVPR2 and β-tubulin (β-tub) in kidneys of Bbs10 +/+ ; Cadh16Cre +/− and Bbs10 fl/fl ; Cadh16Cre +/−; the immunoblots are shown in Additional file 4: Figure S4A, B. h AVP plasma levels in Bbs10 fl/fl ; Cadh16Cre +/− and control Bbs10 +/+ ; Cadh16Cre +/− under 24-h fluid restriction or in normal conditions. (n = 5 per genotype). Values are expressed as mean ± SEM. *p < 0.05.
