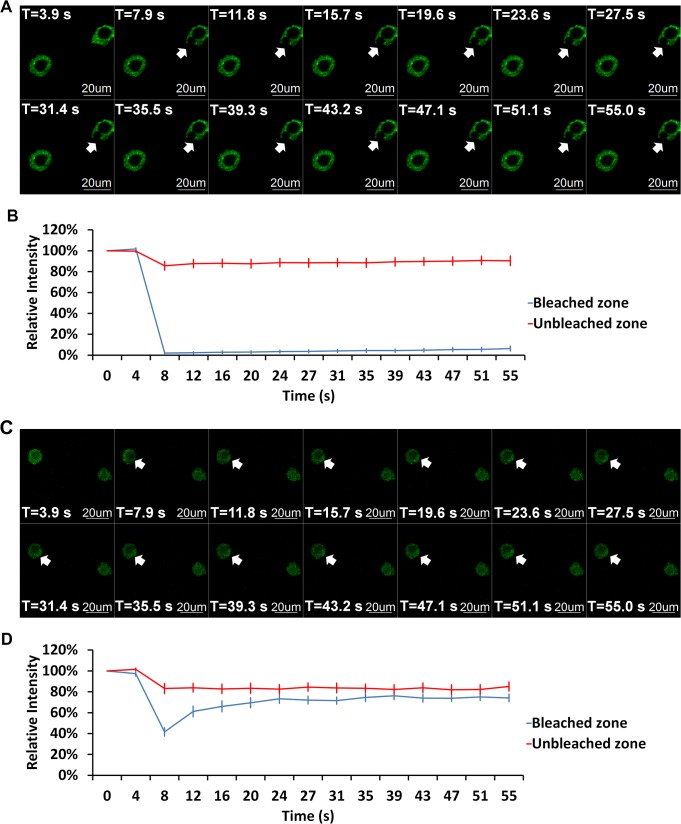
Fig 4. FRAP analysis of AtH1.1 and AtHMGB1 in prophase nuclei.
(A) FRAP images of AtH1.1-EGFP transgenic BY-2 cells. (B) FRAP recovery curves of AtH1.1-EGFP. (C) FRAP images of AtHMGB1-EGFP transgenic BY-2 cells. (D) FRAP recovery curves of AtHMGB1-EGFP. For (B) and (D), blue lines showed the relative signal of the bleached zones. Bleach started at the 3.39th second and ended at 3.99th second. Red lines showed the relative signal of the unbleached zones. Bleaching sites were marked with white arrow heads. Each curve represented the average of 9 and 10 separate FRAPs analysis of AtH1.1 and AtHMGB1, respectively. Error bar: standard error.

