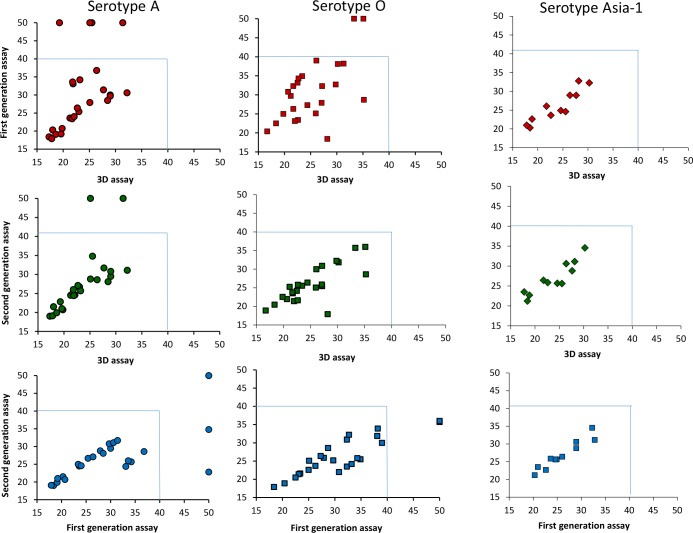
Fig 4. Comparison of cycle threshold (CT) values obtained in the different RT-qPCR assays.
CT values obtained with the pan-FMDV 3D assay, the Reid et al. [33] assays and “second generation” serotype-specific assays described here for serotypes A, O and Asia-1 viruses are shown.

