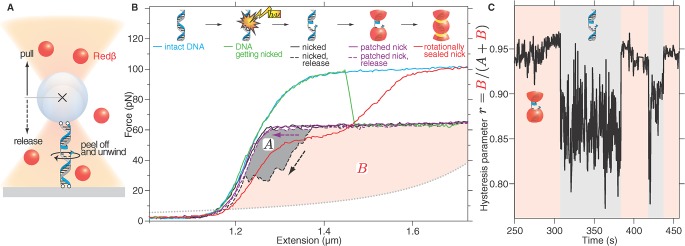
Fig 3. Lateral interaction of Redβ monomers reinforces the filament.

(A) Schematic of optical tweezers DNA stretching experiments. (B) Force-extension plot of dsDNA attached to the microsphere and surface by all four strand termini in the presence of Redβ. Intact DNA shows a high-force plateau typical for rotationally constrained dsDNA (cyan line). A nick introduces rotational freedom leading to a plateau at ≈60 pN (green line) and hysteresis during release (black dashed line, grey area A). Subsequently, the hysteresis disappeared (purple dashed line), and repeated cycles plateaued at 60 pN (purple solid line). Occasionally, the higher-force plateau was reattained (red line). In these cases, the force-extension curve suggests that the dsDNA was sealed by Redβ but underwound. (C) Time course of the hysteresis parameter r. The hysteresis parameter r is the ratio between the red area (B) and the total area (A + B) demarcated in (B) by the measured force-extension curves and the expected force-extension curve of ssDNA (dotted line in [B]). The nicked, hysteresis state is characterized by (mean ± standard deviation) versus for the patched state. Each stretch/release cycle was 1-s long and produced one point in the time course of r.
