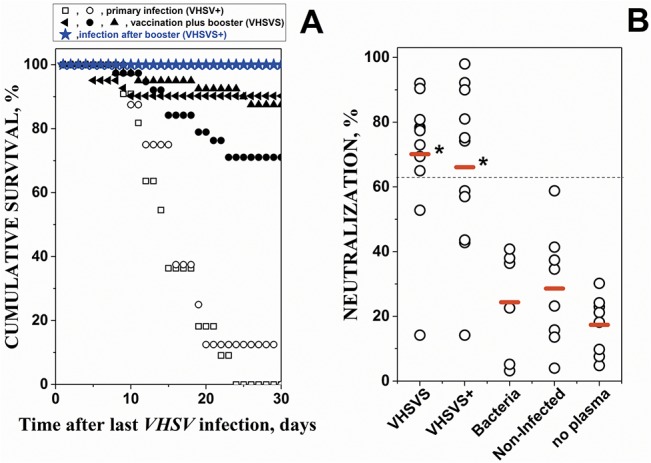
Fig 1. Cumulative percent survival of zebrafish after VHSV infections (A) and levels of anti-VHSV neutralizing antibodies (NAbs) in plasma (B).

A) primary infected VHSV+ and vaccinated plus booster VHSVS were obtained as described in detail in methods and summarized in S1 Fig After infection-by-immersion in 107 ffu of VHSV per ml, daily cumulative survival at 14°C was calculated for each experiment using the formula, 100 x (1- daily cumulative mortality / total mortality after 30 days) (n = 15 to 35 zebrafish per experiment). Different symbols (circles, squares, triangles and stars) correspond to independent experiments. Open circles and squares, primary infection-by-immersion at 14°C (VHSV+). Solid symbols, vaccination- by-injection at 18°C plus booster-by-immersion at 14°C 3-months later. Blue stars, infection-by-immersion at 14°C after booster of the VHSVS fish (VHSVS+). B) Levels of neutralizing Abs (NAbs) in plasma from: vaccination plus booster VHSVS (6 months after the first infection-by-injection); infection after booster VHSVS+ (VHSVS 2-days after a third infection); chronically infected with bacteria (bacteria); non-infected (NI) zebrafish and no added plasma (no plasma). The percentage of infected cells was calculated by the formula, 100 x number of cells with fluorescences above the threshold / total number of cells gated per well. VHSV-infected cell controls in the absence of added zebrafish plasma showed that 55% of the EPC cells were infected (fluorescent). The results were then expressed in percentage of neutralization by the formula, 100–100 x % of infected cells / 55. Each open circle corresponds to an individual zebrafish. Red horizontal lines, mean neutralization percentage values. Dash line, mean + 2 standard deviations of neutralization percentage of non-infected plasma (n = 8). *, mean percentage values significantly higher than non-infected mean at the p<0.05 level (Student t-test).
