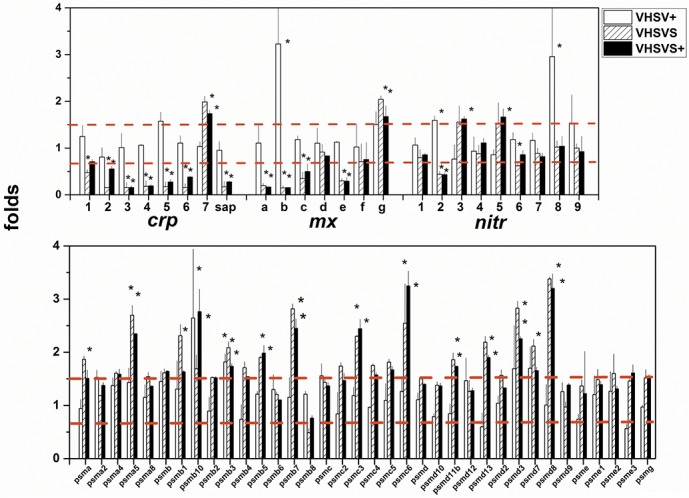
Fig 4. Differential expression profiles of individual crp, mx, nitr and psm genes from multigene family GSs.

After normalization and reduction to a list of unique genes, folds were calculated for each gene using the formula: fluorescence of each VHSV-infected replicate / mean fluorescences from the NI replicates (n = 4). Means and standard deviations were then obtained for each gene and outliers were removed to obtain final folds (n = 4). A, crp, mx and nitr multigene families. B, psm multigene family. Open bars, VHSV+. Hatched bars, VHSVS. Black bars, VHSVS+. Red horizontal bars, 1.5- and 0.66-fold thresholds. *, significantly >1.5 or <0.66 at the p = 0.05 level (Student t-test).
