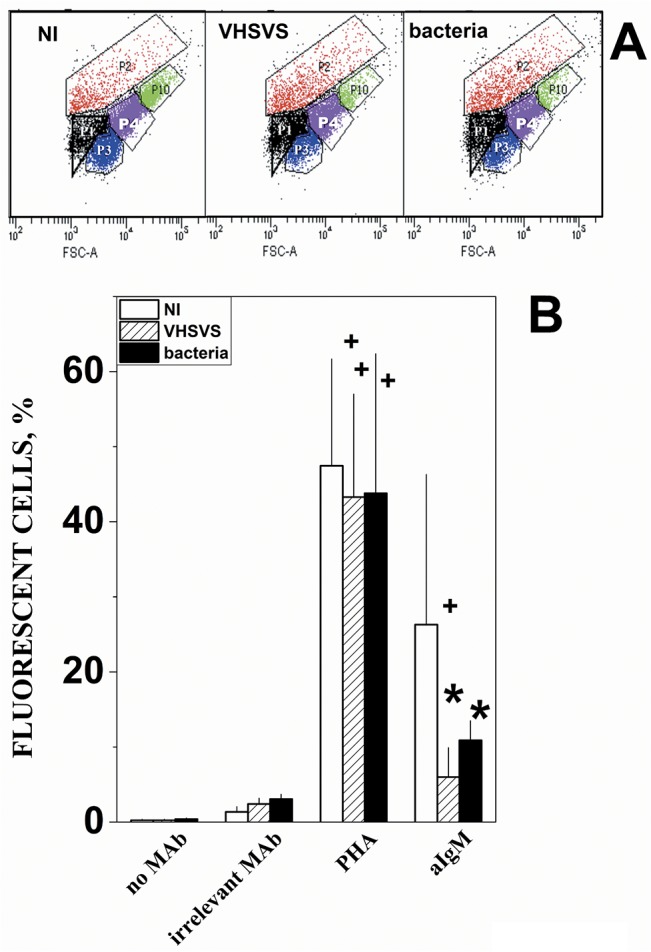
Fig 6. Flow cytometry scatter plots (A) and distribution of IgM+ cells in lymphoid organs (B).

A) Representative FSC/SSC scatter plots used to define cellular populations and composition (mean ± standard deviations, n = 9) in pooled lymphoid organs from different phenotypes. P1 black (13.2 ± 5.5%) and P3 blue (12.6 ± 4.9%), damaged cells and/or cellular debris identified using sonicated cells. P2 red (20.4 ± 21.2%). P4 purple (40.8 ± 21.5%), lymphocytes as determined before [39]. P10 green (4.3 ± 2.7%). B) Cells from lymphoid organs were pooled from 3 NI (open bars), VHSVS (hatched bars) or bacterial-survivor (black bars) zebrafish phenotypes. Cells were stained with no MAb (in the absence of any MAb), an irrelevant MAb, FITC-phytohemaglutinin (PHA) and zebrafish crossreacting anti-trout IgM MAb 6B7 (aIgMt). The percentage of cells above the threshold fluorescence in the P4 population was calculated by the formula: 100 x number of cells in P4 with fluorescence above the threshold / number of P2+P4+P5 cells. Mean and standard deviations were represented (n = 2). +, significantly different from the staining with the irrelevant MAb. *, significantly different from irrelevant MAb or NI stained with anti-IgM.
