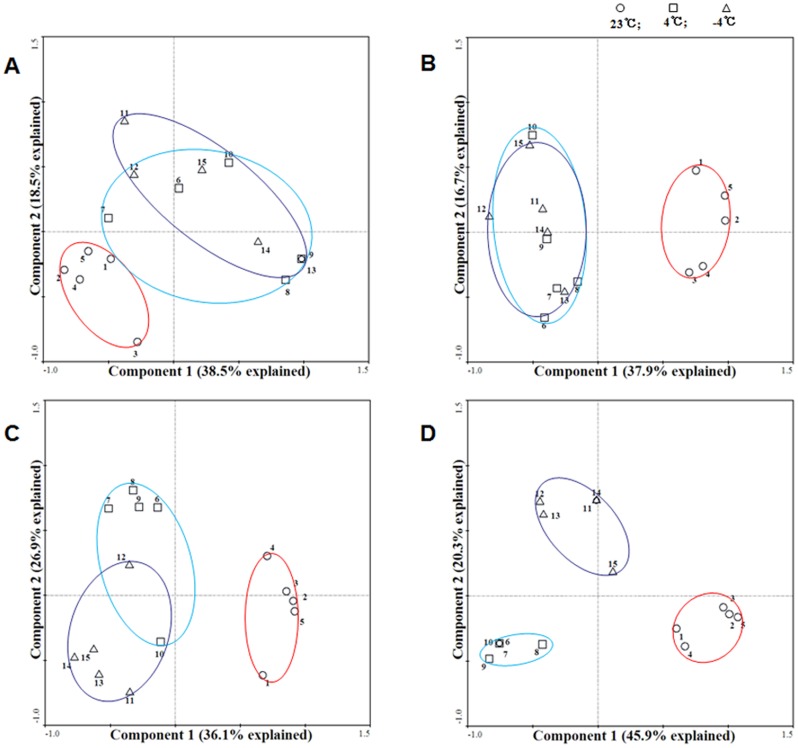
Fig 3. Principal component analysis (PCA) of the different cold treatments.
Principal component analysis (PCA) of the comparisons of DNA methylation changes among the 23°C, chilling (4°C) and freezing (-4°C) treatments at each treatment time. (A) 0.5 h, (B) 3 h, (C) 12 h, (D) 24 h. The trends in DNA methylation changes at 23°C, 4°C and -4°C are represented by red circles, cyan circles and purple circles, respectively. Numbers 1–5 represent five individual plants at 23°C, 6–10 represent five individual plants at 4°C, and 11–15 represent five individual plants at -4°C. The percentage of the variance that is explained by each principal component is given in the iconograph near the axes. The first two components together explain greater than 50% of the variations in all of the PCA modes.

