
Figure 1. Number of participants quit, relapsed, and lost by wave.
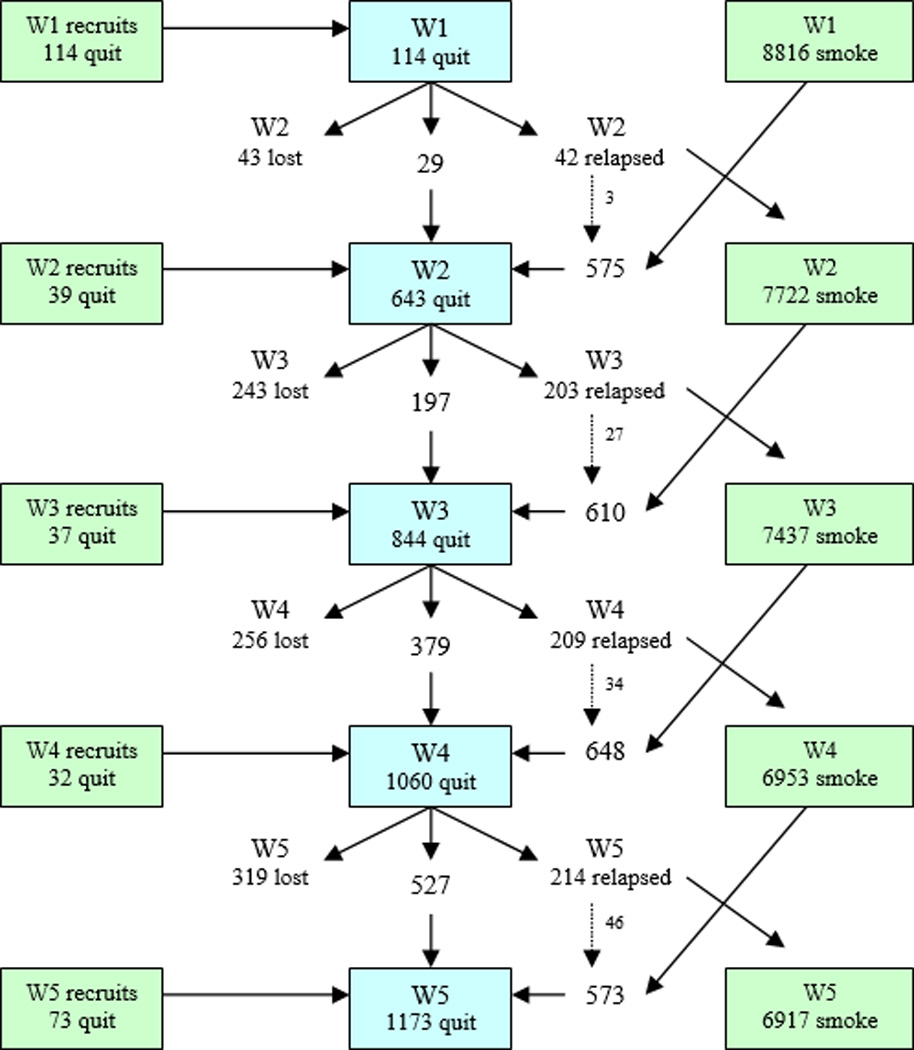
Note: The number of new recruits quit at each wave is shown in the boxes on the left. The dotted arrows indicate that some relapsers had quit again by the next wave. The number of smokers at each wave is shown in the boxes on the right; some of these smokers had quit by the subsequent wave.