
Fig. 2.
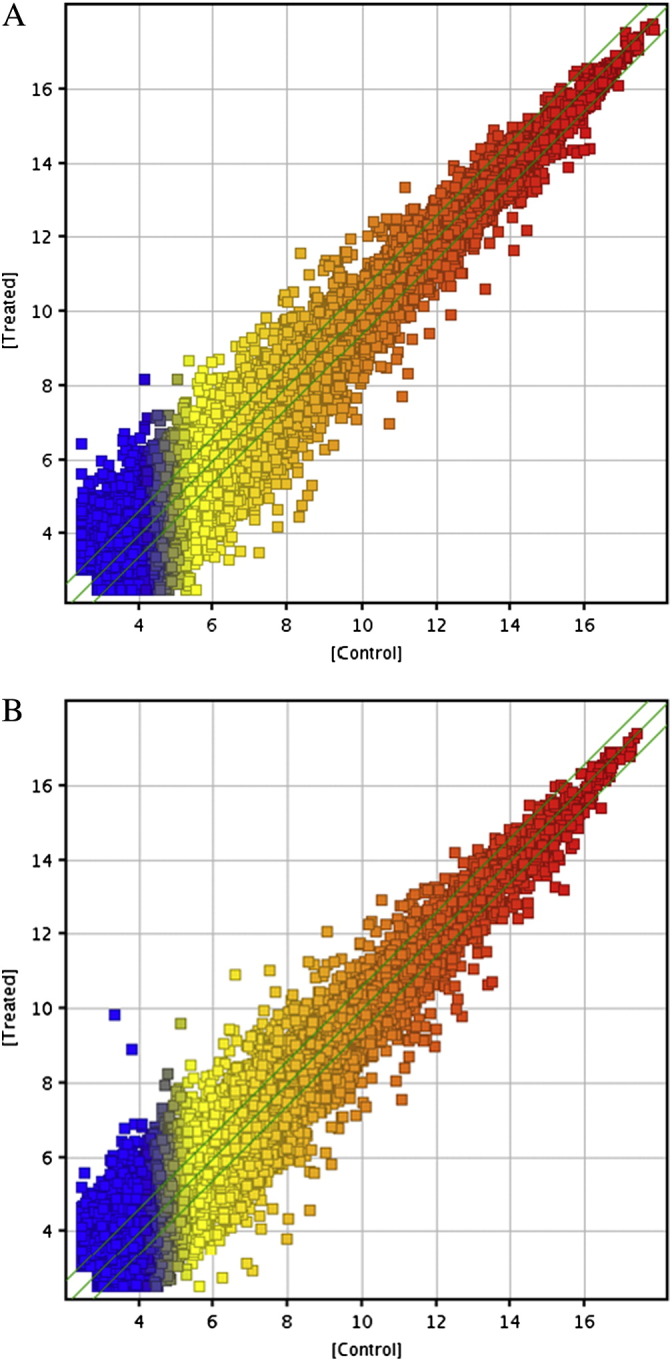
Scatter plots showing correlation of signal values between Control and Treated. (A) The lncRNA expression of Control (horizontal axis) vs Treated (vertical axis). (B) The mRNA expression of Control group (horizontal axis) vs Treated group (vertical axis). Control group represents THP-1 macrophages (three samples). Treated group represents THP-1 macrophage-derived foam cells (three samples). The values of X and Y axes in the scatter-plot are the normalized signal values of the samples (log2 scaled) or the averaged normalized signal values of groups of samples (log2 scaled). The green lines are Fold Change Lines (the default fold change value given is 1.5). The lncRNAs/mRNA above the top green line and below the bottom green line indicated more than 1.5 fold change of lncRNAs/mRNA between the two compared samples or the two compared groups of samples.