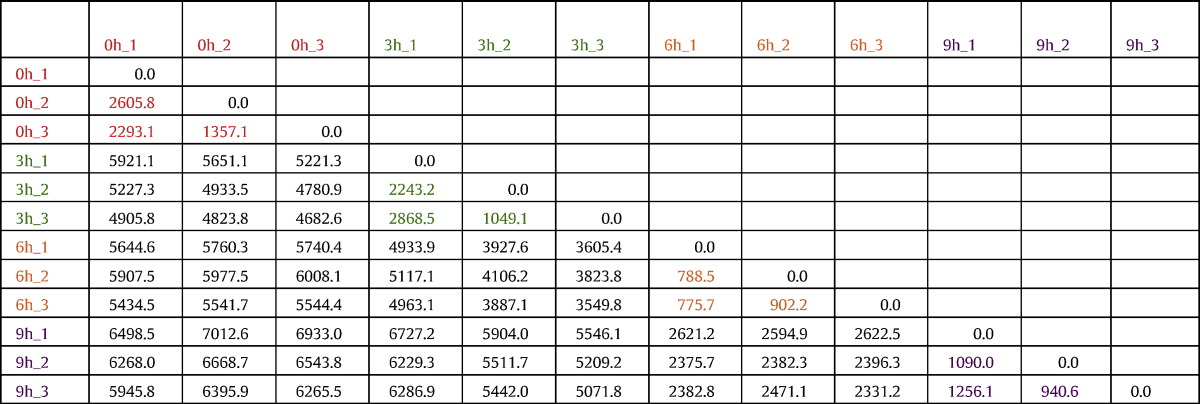
Table 2.
Euclidean distance between each pair of libraries. Replicates of different treatment time are shown with the same colors: red, green, orange and purple for 0, 3, 6 and 9 h, respectively. The distance between each replicate pair is shown with the same color-coding. The matrix shows that pairs belonging to the same treatment time have lower distance (i.e., they are more similar) than pair of libraries belonging to different times.