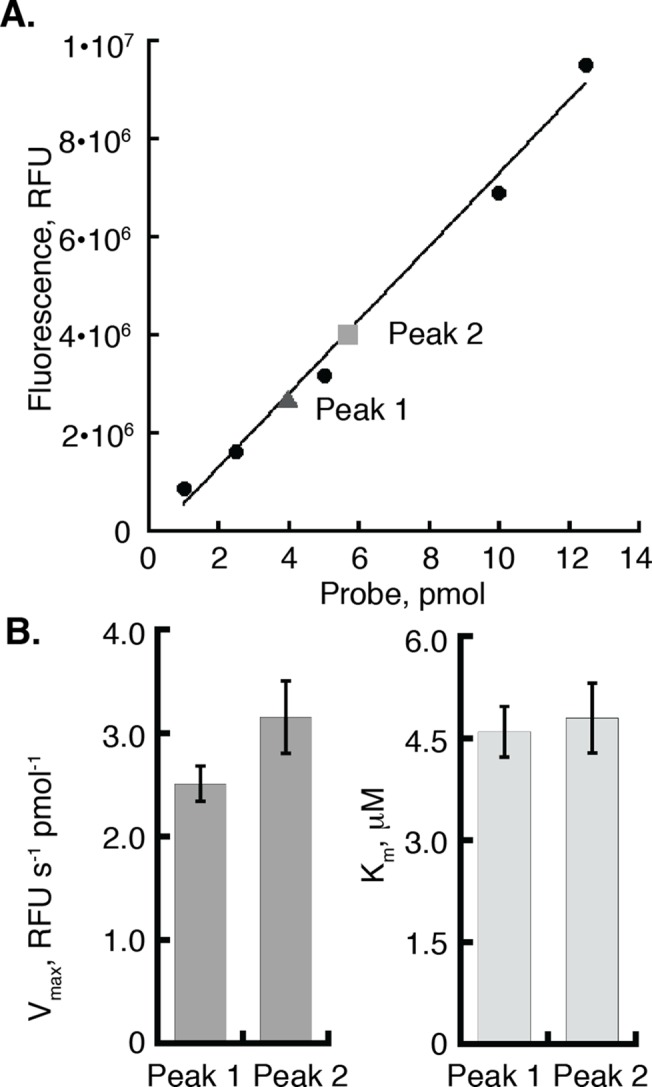
Fig 3. There are more active LipY molecules in peak 1 compared to peak 2.

(A) Equal concentrations of total LipY Peak 1 and Peak 2 were incubated with a 1.5 molar excess of TAMRA-FP serine hydrolase probe for 30 minutes at room temperature. A standard was created using the probe alone. The amount of active Peak 1 and Peak 2 were calculated based on the standard curve. (B) Bar graph showing the Vmax and Km from Michaelis-Menten curves comparing equal amounts of total LipY from Peak 1 and Peak 2 using the DGGR substrate. Error bars represent the standard error of the mean of 6 independent measurements[32].
