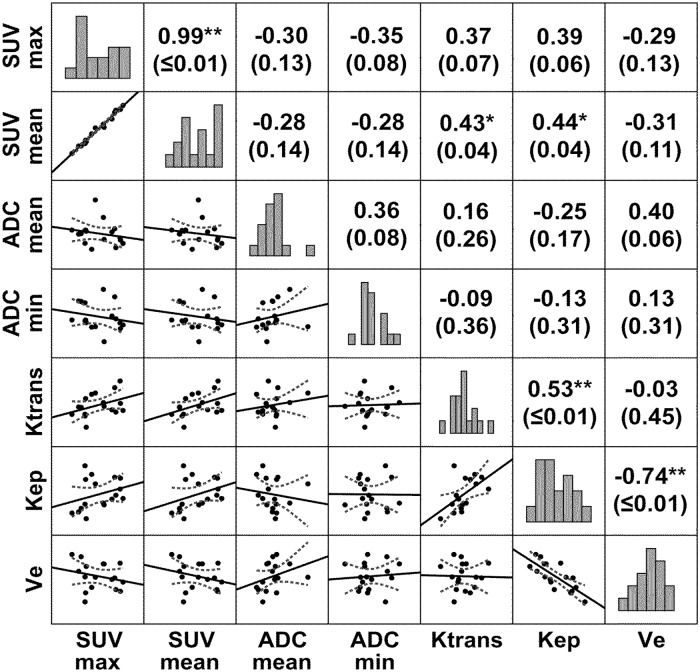
Fig 3. Correlation map of the different molecular imaging parameters in HNSCC.
Correlations between 18F-FDG-PET, T1w-DCE and DWI were computed using Spearman’s non-parametric rank sum correlation coefficient. Numbers in parentheses represent p-values. * p≤ 0.05; ** p≤ 0.01. Bar graphs indicate the distribution of values.

