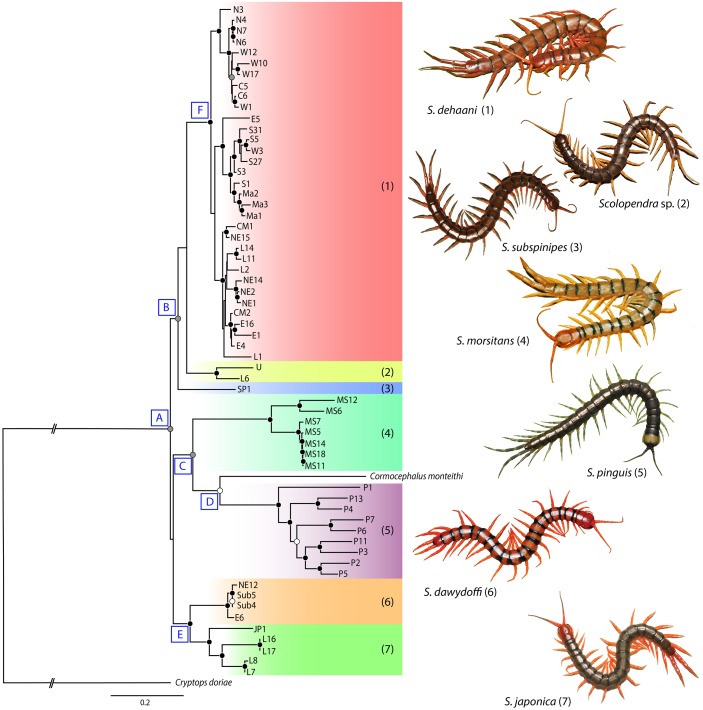
Fig 1. Phylogenetic tree of Scolopendra mainland Southeast Asia.
Relationships among Scolopendra and two outgroups indicated similarly both in Maximum likelihood (ML) and Bayesian inference (BI) of the concatenated COI, 16S and COI partial gene analyses. Significant support values in ML and BI are indicated by three colouration circles; black circle = support both in ML and BI (above 70% bootstrap in ML and 0.95 posterior probability in BI), white circle = support only in ML, grey circle = support only in BI. The gradient colouration bars on the tree represent the genetic affinities of populations relative to morphological identification in each species.

