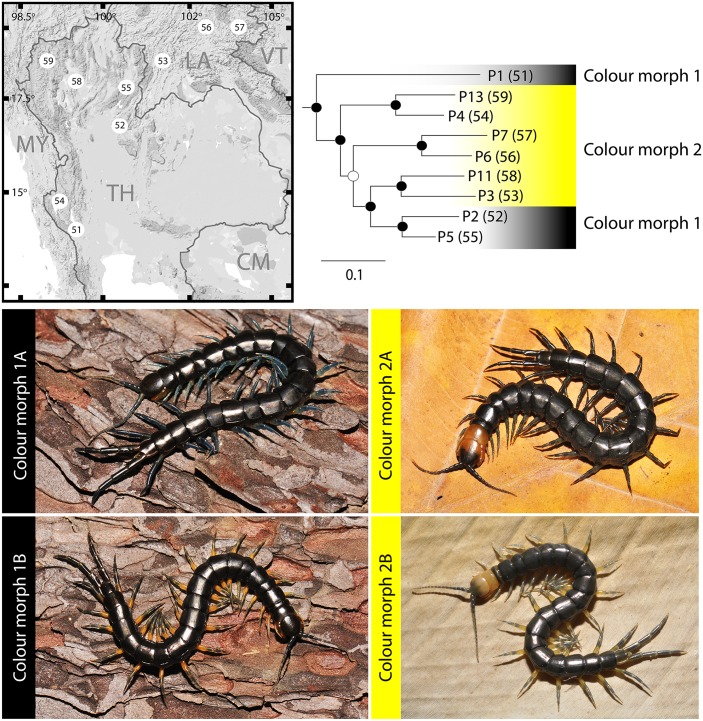
Fig 4. Phylogenetic tree of S. pinguis based on genetic structure of its populations.
Colour gradient bar indicates colour morphs of sampled individuals that divide into two patterns; colour morp 1—blackish population (monochromatic); colour morph 2- yellowish—black population (dichromatic). Four live colour morph pictures depict the variability of colouration on legs of the two colour morphs in S. pinguis; colour morph 1A and 2A—animal with dark blue legs, colour morph 2A and 2B—animal with yellowish legs with blue stripes on distal part.

