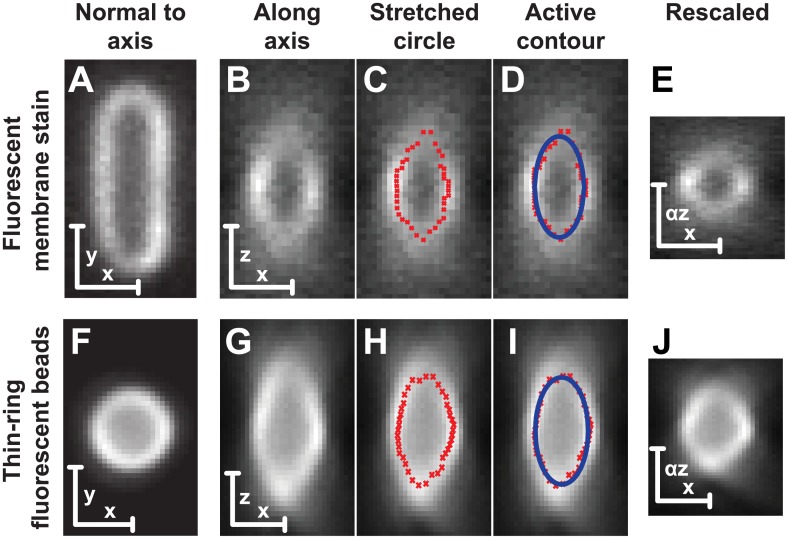
Fig 3. Fluorescent images showing the disparity between slices in a single focal plane and along the focal dimension.
Scale bars are 1 μm. (A-E) E. coli cell stained with a membrane dye (FM 4–64). (F-J) 1 μm sphere with a fluorescent ring stain. (A,F) xy slice (B,G) xz slice showing the apparent elongation of the object along the focal axis. (C,H) Active contour fit to the ridge of maximal intensity in red. (D,I) Stretched circle fit in blue r 2 = (αz)2 + x 2. (E,J) xz slice shown after scaling z by α.

