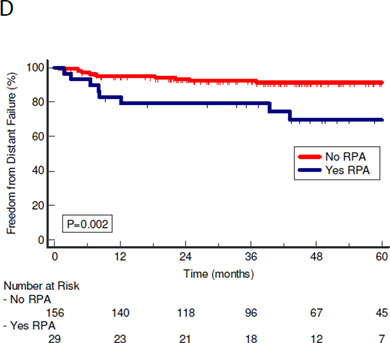
Figure 1.
Kaplan-Meier curves of patterns of failure of patients with and without RPA. P values are calculated using log-rank test. A: Freedom from local failure with local failure as first failure. B: Freedom from regional failure with regional failure as first failure. C: Freedom from locoregional failure D: Freedom from distant failure with distant failure as first failure.
RPA=Retropharyngeal adenopathy; LRF=locoregional failure


