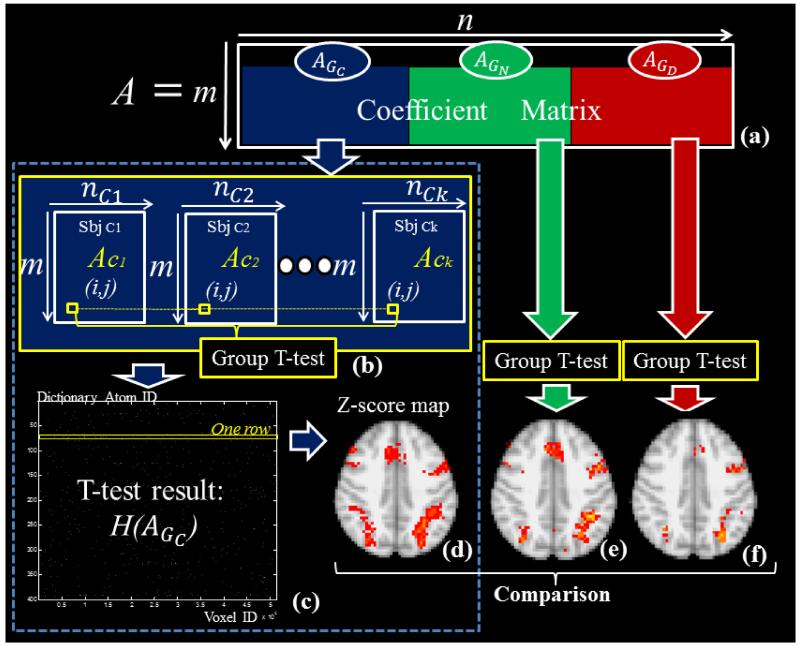
Fig.2.
(a) A matrix is composed of three groups of subjects. (b) Correspondence of elements in AGC and group-wise null hypothesis T-test for each element. (c) The group-wise T-test results of acceptance of null (black dots) or rejection (white dots) (P<0.05). (d) Each row in (c), which represents a network component, is mapped back to the brain volume color-coded with z-scores. (e) and (f) are z-score maps derived from GN and GD with the same method of (b-d).

