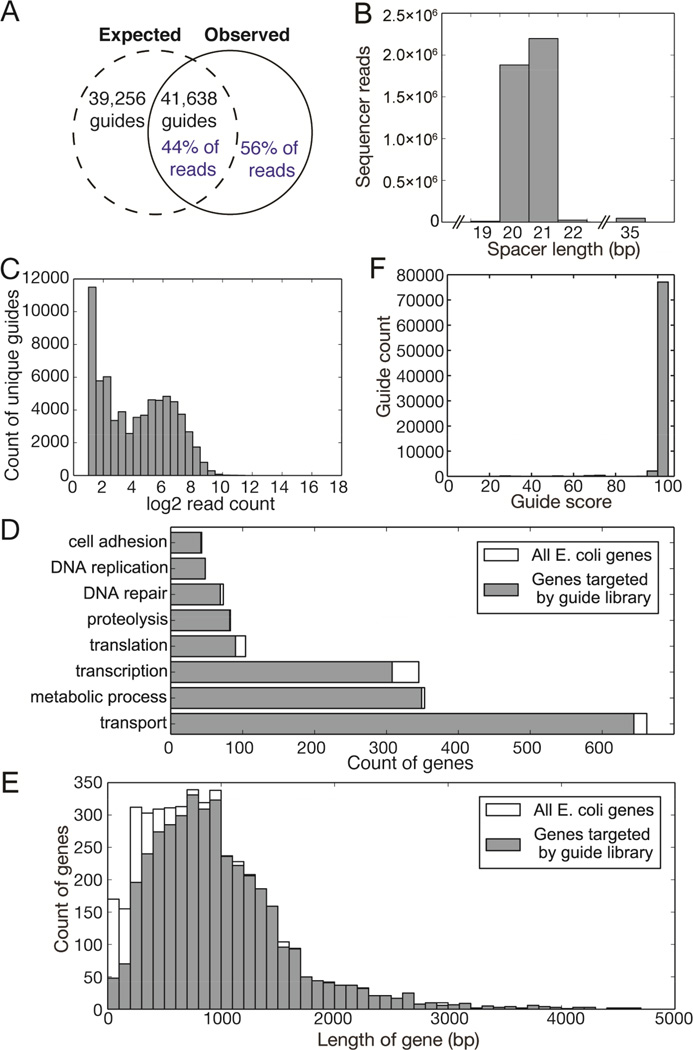
Figure 4. A complex guide library targeting sequences within the E. coli genome.
A: Comparison of theoretical maximum number of guides generated by E. coli genome digestion with guides identified by sequencing (black text) and of sequencing reads that represent expected guides versus those reads that do not correctly target E. coli PAM-adjacent 20mers (blue text). B: Length distribution of variable spacers (region between T7 promoter and sgRNA guide body) in library as determined by high-throughput sequencing. C: Distribution of abundance of unique guides within library. D: Coverage of selected GO-term gene groups by library sgRNAs compared to the total number of genes annotated by those GO terms. E: Analysis of genes targeted by guides in sequenced library as binned by gene length. F: In silico analysis of guide specificity as predicted to be produced by digestion/ligation of E. coli genomic DNA. A score of 100 indicates no predicted off-target effects.

