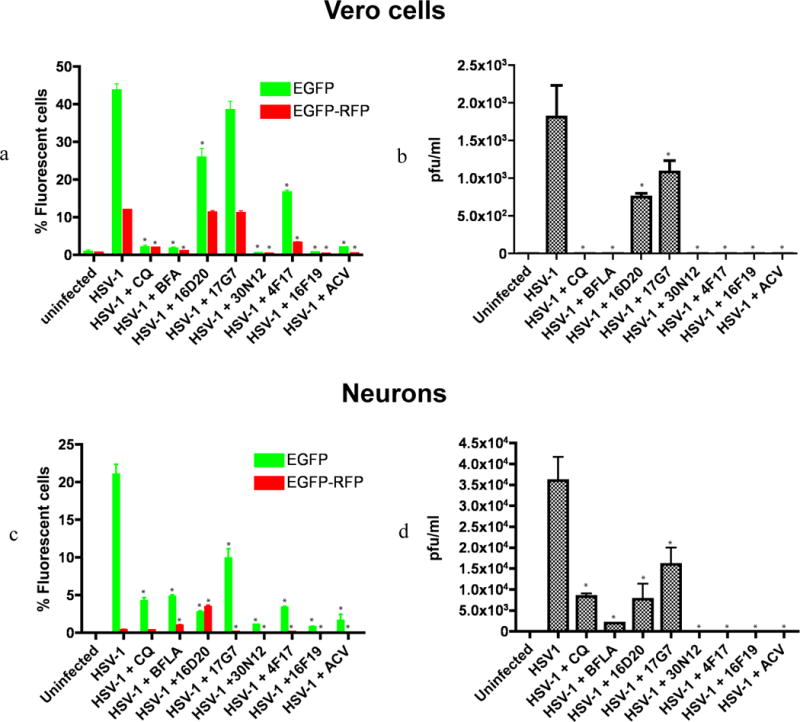
Figure 2. Comparison of inhibitory effects of test compounds on lytic HSV-1 infection.

(a) Flow cytometry (FC) analysis of uninfected and HSV-1 infected Vero cells in the presence or absence of test compounds using HSV-1 expressing EGFP from an IE gene promoter and RFP from a late gene promoter. The fractions of cells showing fluorescence of the appropriate color are indicated. *p≤0.0019. (b) Plaque assays of virus produced in the supernatant of HSV-1 infected Vero cells titrated on Vero cells, shown as plaque forming units per milliliter (PFU/ml). *p≤0.0017. (c) FC analysis of uninfected and HSV-1 infected iPSC-neurons in the presence or absence of test compounds. *p≤0.026. (d) Plaque assays of virus produced in the supernatant of HSV-1 infected iPSC-neurons titrated on Vero cells, shown as plaque forming units per milliliter (PFU/ml). *p≤0.045. The data represent an average of three independent experiments. CQ: chloroquine (50 μM); BFLA: bafilomycin A1 (0.1 μM); ACV: acyclovir (50 μM). Test compounds were used at a concentration of 50 μM. pfu: plaque forming units. Error bars represent standard deviations.
