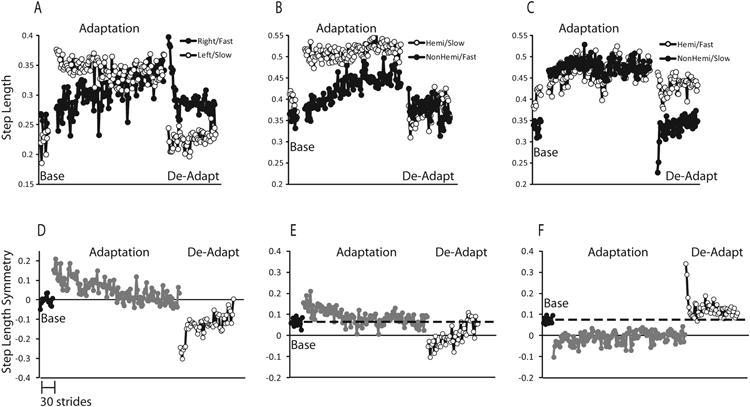
Figure 2. Representative Subjects for Step Length.

Individual limb data during the baseline, adaptation, and de-adaptation periods from a representative participant who is neurologically intact (A), a stroke participant exposed to the exaggerated/HemiSlow condition (B), and the reduced aymmetry/HemiFast condition (C). Symmetry data during the baseline, adaptation, and de-adaptation periods from a representative participant who is neurologically intact (D), a representative stroke participant in the exaggerated/HemiSlow condition (E) and in the reduced asymmetry/HemiFast condition (F). Each data point represents the average over 3 strides of data. In E and F, the dashed line represents baseline data. It should be noted that although the HemiSlow condition resulted in exaggerated asymmetry for this subject for another subject the opposite may have been true.
