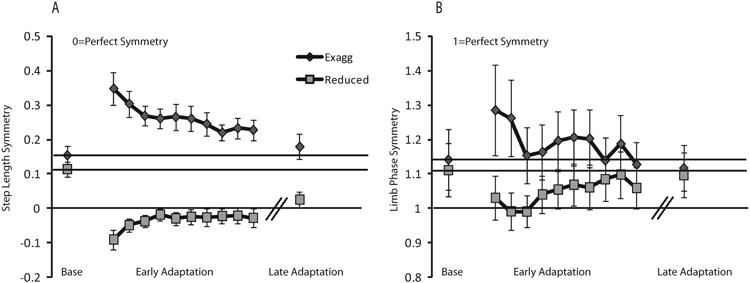
Figure 4.

Step length adaptation asymmetry (A) and limb phase adaptation asymmetry (B) at baseline (Base), early adaptation, and late adaptation averaged over subjects in each condition. Baseline data is averaged over the entire baseline period. Each data point in the Early adaptation period represents an average of 10 strides. Late adaptation data is averaged over the last 20 strides during adaptation. Error bars represent standard error. Black lines represent baseline for each individual group.
