
Figure 5. Asymmetry of Adaptation over Strides.
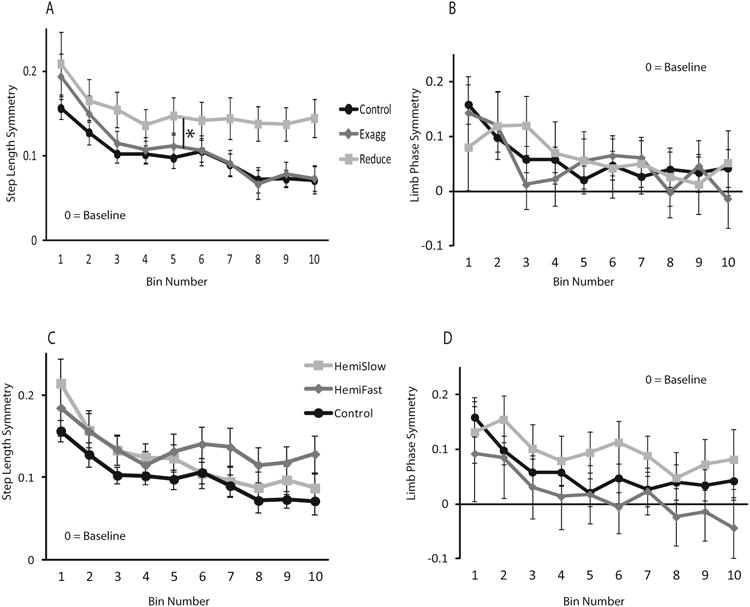
A: Step length asymmetry exaggerated and reduced conditions and neurologically intact group, B: limb phase asymmetry exaggerated and reduced conditions and neurologically intact group, C: Step length asymmetry HemiSlow and HemiFast conditions and neurologically intact group, D: limb phase asymmetry HemiSlow and HemiFast conditions and neurologically intact group. In order to compare across groups, negative adaptation data for the reduced condition was transformed across the x-axis before figures and calculations were completed. Each data point represents an average of 10 consecutive strides. Zero equals baseline. Error bars represent standard error. * indicates a significant difference between the reduced asymmetry group and the neurologically intact group.