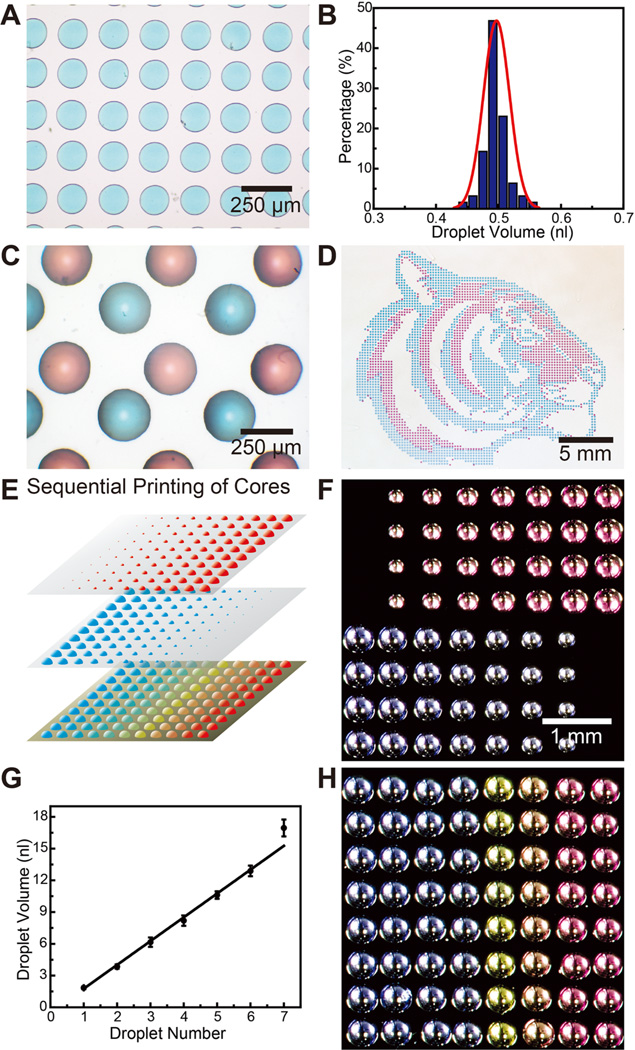
Figure 2.
Printing of aqueous cores. (A) Optical micrograph of an array of blue aqueous cores with a center-to-center spacing of 200 µm (colors are from commercial food dyes). (B) The corresponding histogram shows the distribution of droplet volumes. (C) Optical micrograph of a multiplexed array of red and blue capsule cores with spacing of 200 µm between cores of opposite color. (D) Optical image of large scale (>4000) multiplexed patterned red and blue capsule cores in the shape of a “Princeton tiger”. (E) Schematic illustrating the generation of capsule arrays with varying compositions. Arrays with varying volumes are generated by dispensing multiple droplets in the same locations. Overlaying them creates arrays with varying compositions. (F) Optical micrographs of two different pH capsule arrays with varying core volumes. The number of dispensed drops varies from 1 to 8 drops across the array. (G) Plot showing a linear relationship of core volume to the number of droplets dispensed. (H) Optical micrograph of a 2D array with varying pH, adjusted by the ratio of H2SO4 and NaOH within, indicated by the color of m-cresol purple.

