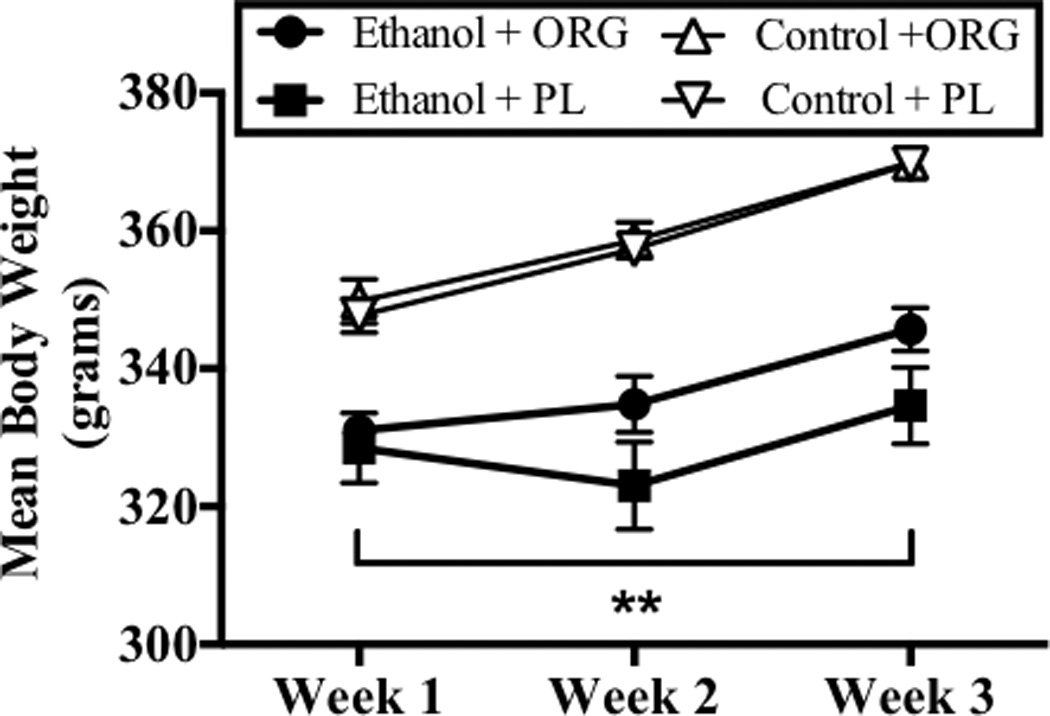
Figure 1.

Body weight data were obtained daily on week 1, 2, and 3. Data points show mean weekly body weights for subjects exposed to ethanol and ORG 34517 (60 mg/kg; n=6; empty circle), ethanol and PL (60 mg/kg; n=5; filled circle), control and ORG 34517 (60 mg/kg; n=6; empty triangle), and control and PL (60 mg/kg; n= 5; filled triangle). Two asterisks indicate a significant interaction of diet and week.
