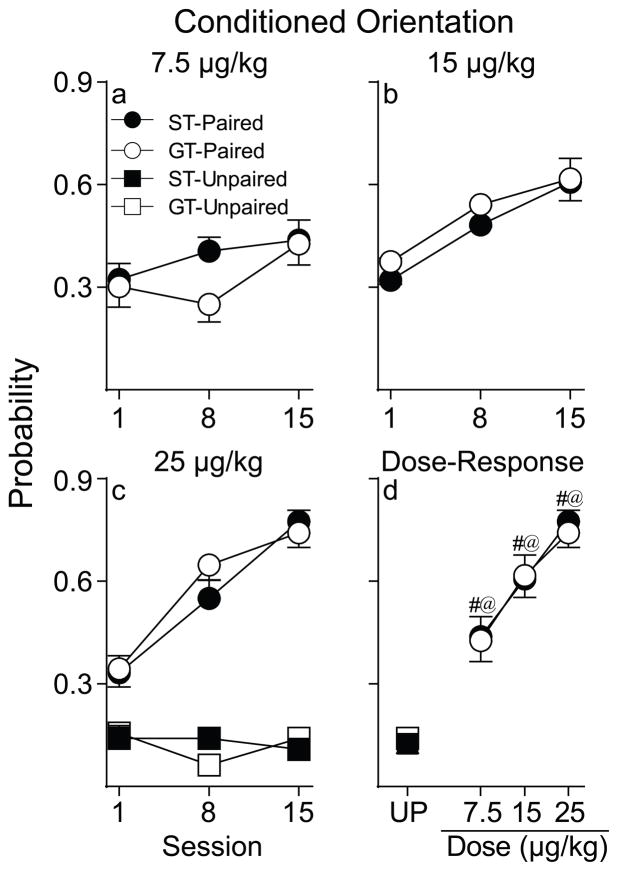
Fig. 2.
Probability of conditioned orientation to a cue associated with a non-contingent intravenous injection of nicotine. Data are illustrated as the mean ± SEM. (a) Conditioned orientation in rats that received 7.5 μg/kg nicotine (Paired STs n= 12, GTs n= 12). (b) Conditioned orientation in rats that received 15 μg/kg nicotine (Paired STs n= 14, GTs n= 15) (c) Conditioned orientation in rats that received 25 μg/kg nicotine (Paired STs n= 15, GTs n= 16; Unpaired STs n=8, GTs n=8). (d) Dose-response function for the probability of conditioned orientation on the final day of training where each data point represents an independent group of rats. UP= Unpaired. #, indicates a significant difference between STs and UP rats. @, indicates a significant difference between GTs and UP rats. p< 0.05.

