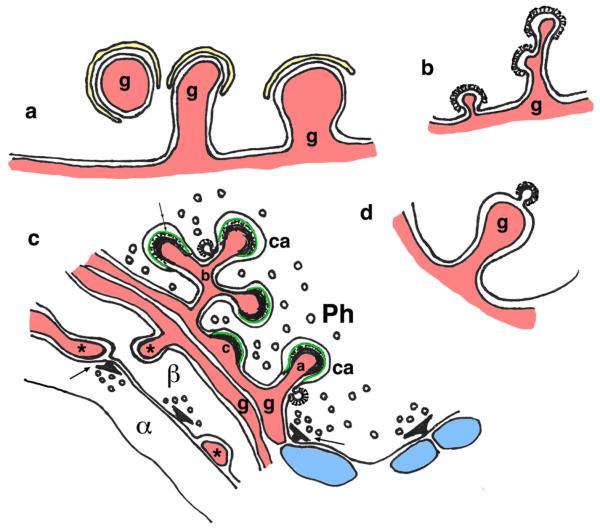
Fig. 9.
Glia-derived invaginating projections. a Glial processes (g) invaginate into a stretch receptor neuron from the crayfish, Astacus leptodactylus (Fedorenko and Uzdensky 2009). Note how a subsurface cisterna (yellow) wraps the end of the invagination. b Glial processes from a surrounding myelin sheath (g; derived from a Schwann cell) invaginate into a neuron of the spiral ganglion of the cat; the tips are surrounded by coated pits (Adamo and Daigneault 1973a). c A composite drawing of the photoreceptor synaptic plexus in eyes of flies showing how glia (g) form specialized invaginating projections called capitate projections (ca) into the photoreceptor (Ph; or retinula) terminals and gnarls (asterisks) associated with β/α fiber pairs. Typically, capitate projections are singular (a; right one), but they also occasionally can be compound (b; left one) or stalkless (c; middle). The head of the projection includes a unique feature—the intercellular substance or “third membrane” (double arrow; green). Synapses are indicated by the specialized T-bar on the presynaptic side. Sometimes, the invaginating projection may be directly part of the synapse; these are called gliapses (arrows) and can involve either a capitate projection or a gnarl. Most of the diagram is based on micrographs from the compound eye (see text for references), but the gliapse involving the capitate projection is based on an image from a retinula terminal of an ocellus (Stark et al. 1989). Note also how coated pits may form along the capitate projections (Fabian-Fine et al. 2003). d Some glial processes that invaginate into terminals can form coated pits on the invaginated membrane without inclusion of the invaginating glial process (g). This is a generalized example representing those found in both the frog neuromuscular junction (Heuser and Reese 1973) and frog brain (Harreveld and Trubatch 1975) (dendritic processes in blue and glial processes in red) (Color figure online)

