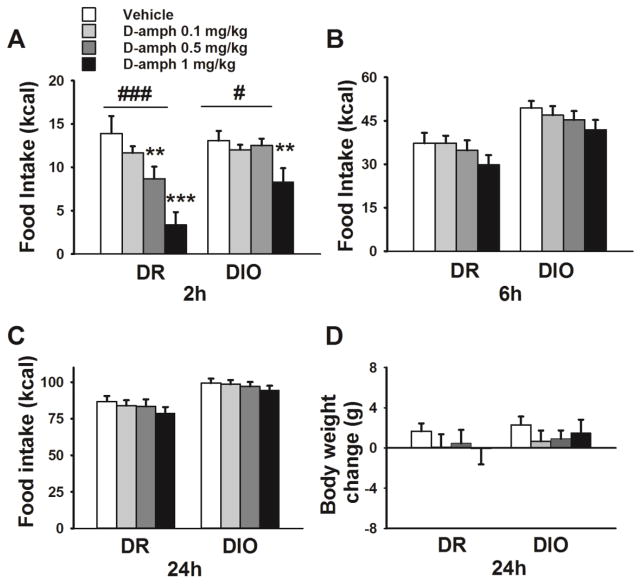
Figure 2.
Effects of D-amphetamine administration on caloric intake and body weight change in chow-fed DIO and DR rats (n=8–10/genotype). Data represent M±SEM of food intake measurements at the 2h (A), 6h (B), and 24h (C) time points. (D) 24h body weight change. # p≤0.05, ### p≤0.001 represent main effects of Treatment. ** p≤0.01, *** p≤0.001 vs. vehicle.

