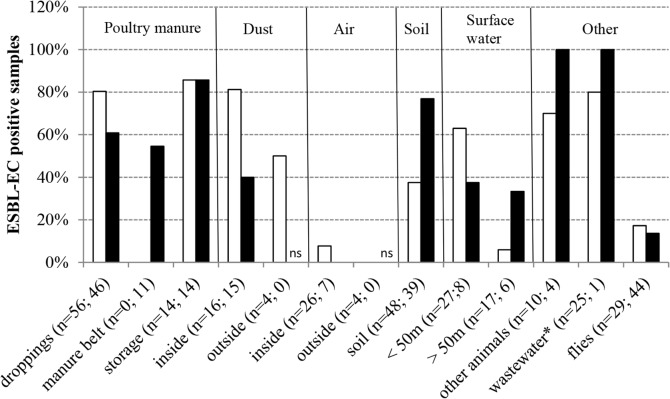
Fig 2. Prevalence of ESBL-producing E. coli in poultry faeces and environmental samples at laying hen and broiler farms.
White bars represent broiler farms, black bars represent laying hen farms. In between brackets (n = a; b) are indicated the numbers of analysed samples at broiler (a) and laying hen farms (b) respectively; ns = not sampled; *includes water from pits and storage basins as well as run-off water and sediment from gullies.

