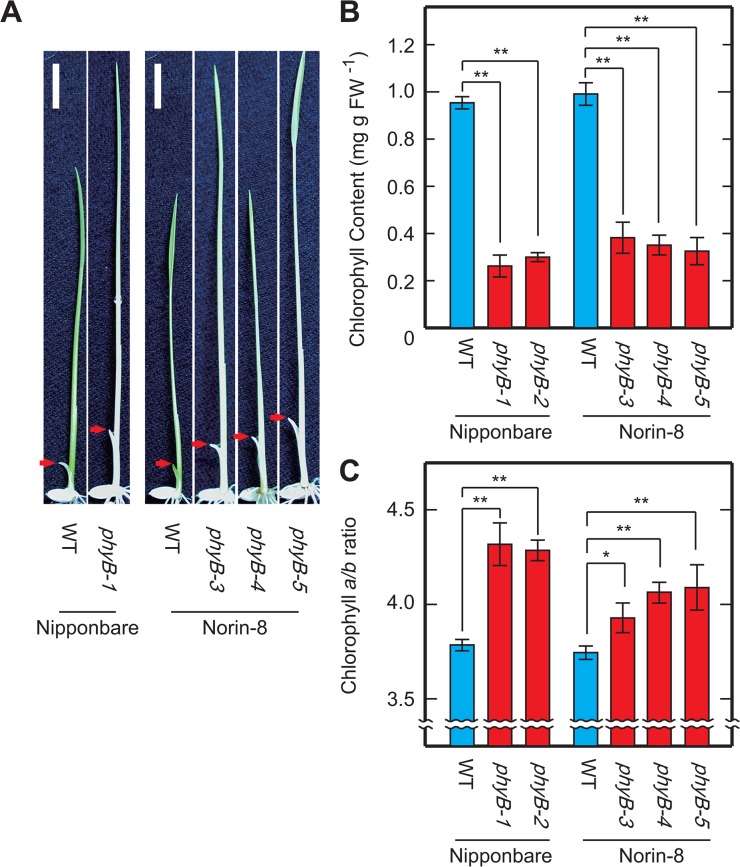
Fig 1. Phenotypes of the rice phyB mutants.
(A) WT and phyB seedlings grown under 15μmol m-2 s-1 of Rc for 7 days. Arrows indicate tip of coleoptiles. Scale bars are 10 mm. Chlorophyll content (B) and chlorophyll a/b ratios (C) in aerial part of the WT and phyB seedlings grown under Rc for 9 days. Data are given as means calculated from three replicates and error bars represent their SD. Symbols, ** and * indicate statistically significant differences compared to WT at P < 0.01 and P < 0.05, respectively, calculated by Welch’s t-test.

