
Fig 2. Chlorophyll content in aerial parts of the phytochrome mutants grown under Rc for 9 days.
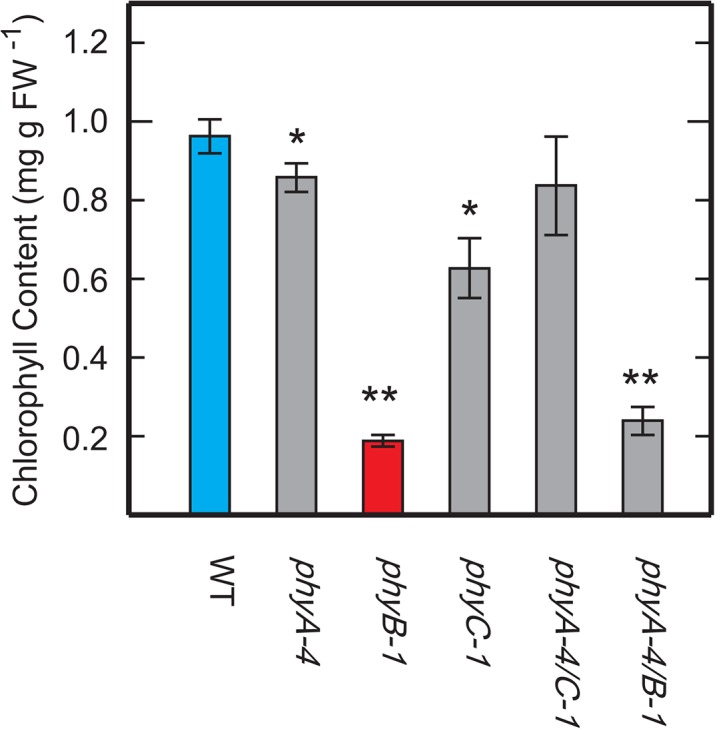
Each value represents the mean with SD of three replicates. Symbols, ** and * indicate statistically significant differences compared to WT at P < 0.01 and P < 0.05, respectively, calculated by Welch’s t-test.