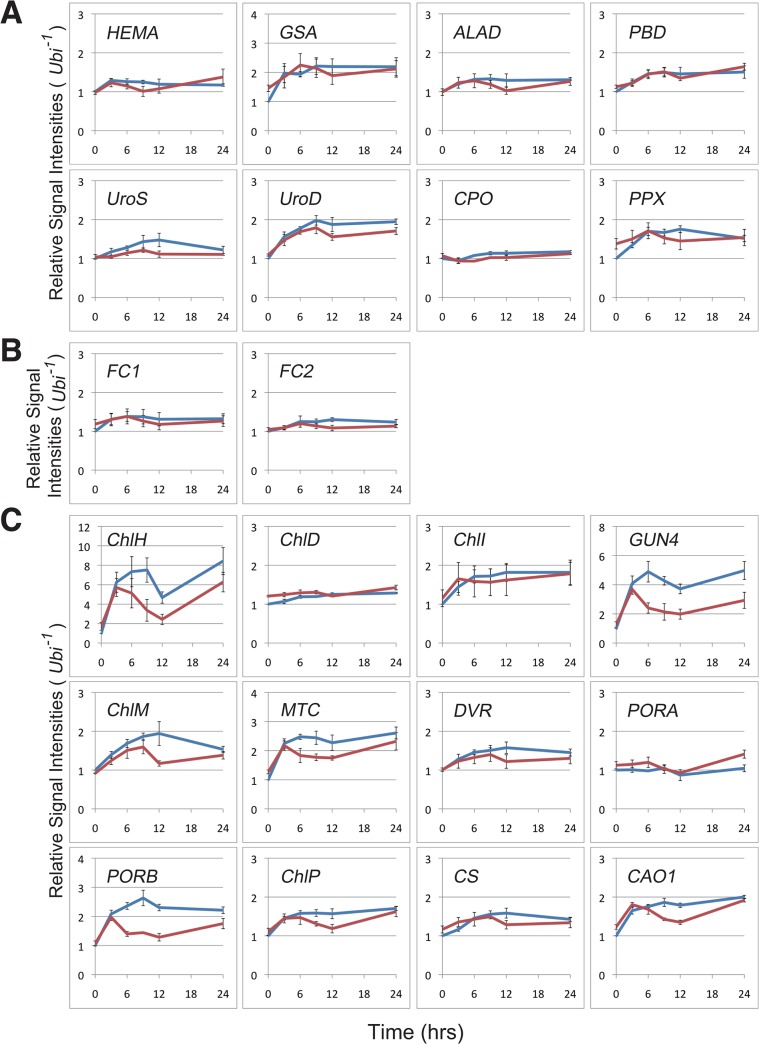
Fig 6. Transcript levels of chlorophll/heme biosynthesis related genes and their changes during the Rc-induced greening experiment.
Blue and red lines indicate relative transcript levels of WT and phyB seedlings, respectively, which were estimated from ethidium bromide-stained gel images. Each value represents the mean with standard errors of at least three biological replicates. Expression patterns of enzymes involved in the chlorophyll/heme common pathway (A), heme branch (B) and chlorophyll branch (C) are indicated.

