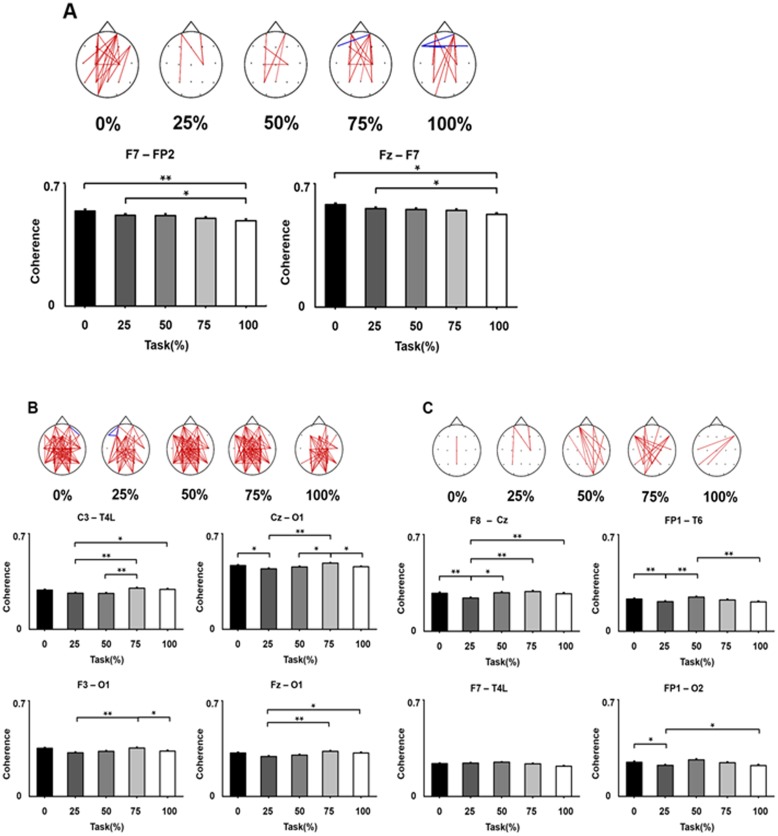
Fig 4. Frequency-specific phase coherence changes over SA modulation.
(A) alpha (8–12 Hz) band. (B) beta (13–30 Hz) band. (C) gamma (31–50 Hz) band. In each frequency band, topographic maps show group-averaged, phase coherence. The dots indicate electrode positions. Red lines indicate significant phase coherence increases and blue lines indicate significant phase coherence decreases, compared to the value of phase coherence in the resting condition. Graphs represent the pairs of electrodes showing significant phase coherence changes according to SA modulation. The bar charts show the electrode pairs with significant variations of phase coherence according to SA changes in three frequency bands (alpha, beta, gamma). The asterisks indicate significant differences between the pairs of % control condition (Bonferroni corrected p-values for pair-wise post-hoc analysis). *p<0.05, **p<0.01.

