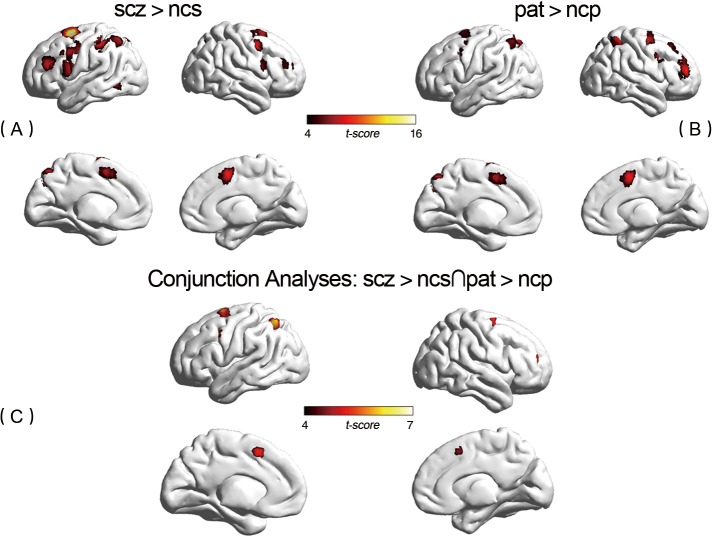
Fig 1. Discrepant Activation between Groups and in Conjunction Analysis Using the BrainNet Viewer software (http://www.nitrc.org/projects/bnv/) [33].
(A) Between-group hyper activation regions related to disease (SCZ > NCS). Regions with significantly (p<0.05, FWE corrected) activation. (B) Between-group hyper activation regions related to familial risk (PAT > NCP). Regions with significantly (p<0.05, FWE corrected) activation. (C) Conjunction analyses depict significant overlap in activity related to disease and activity related to familial risk (SCZ > NCS∩PAT > NCP) (p<0.05, FWE corrected). Clusters are depicted in the right middle frontal gyrus, bilateral precentral gyrus, left inferior parietal gyrus, bilateral superior frontal gyrus, and left supplementary motor area.

