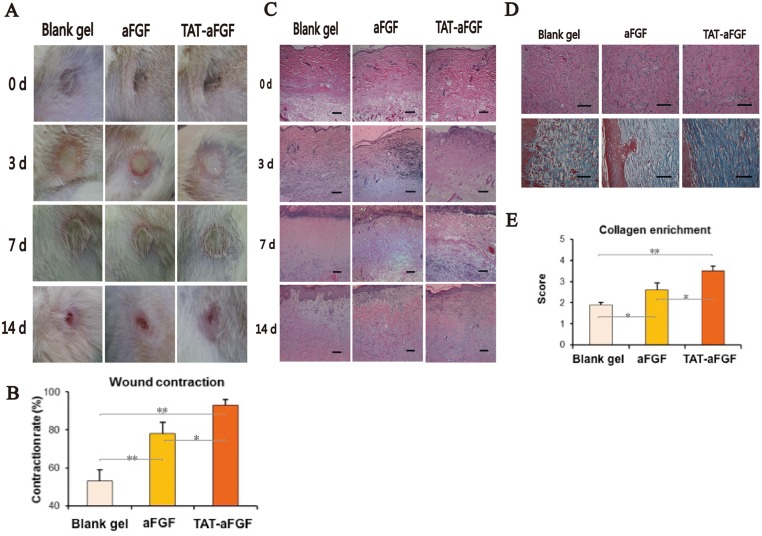
Fig 2. Evaluation of pressure-induced deep tissue injury.
A: Typical macroscopic views of the TAT-aFGF, aFGF and control groups on day 0, 3, 7, and 14. The red open ulcers remained differentially in the three groups on day 14. B: Wound contraction was measured quantitatively, showing a higher rate in the TAT-aFGF group on day 14; * p < 0.05, ** p < 0.01. C: Typical microscopic views (×100) of hematoxylin and eosin (HE) staining of each group on days 0, 3, 7 and 14. Edema and swelling were obvious on day 0. Bar = 100 μm. D: HE staining and Masson staining of tissue biopsies on day 14. Bar = 100 μm. E: Semi-quantitative scoring of sections from mice on day 14. * p < 0.05, ** p < 0.01.

