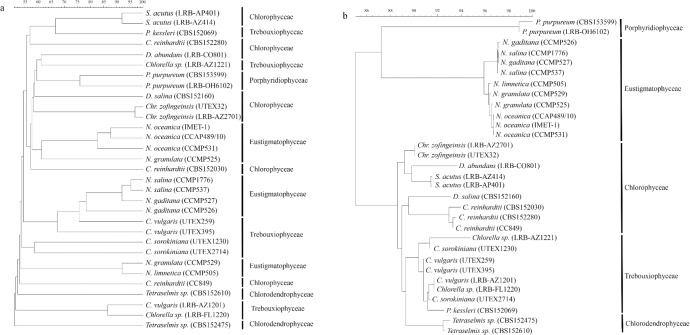
Fig 3. Similarity-based dendrograms representing spectra (a) and 18S rDNA sequences (b) of 31 microalgae.
Class names are listed on the right to facilitate comparison between the two dendrograms. The 18S rDNA sequence-based dendrogram (b) shows grouping of the samples up to the class level. Spectra (a) were clustered using the UPGMA algorithm, while sequences (b) were clustered using the neighbor joining algorithm.

