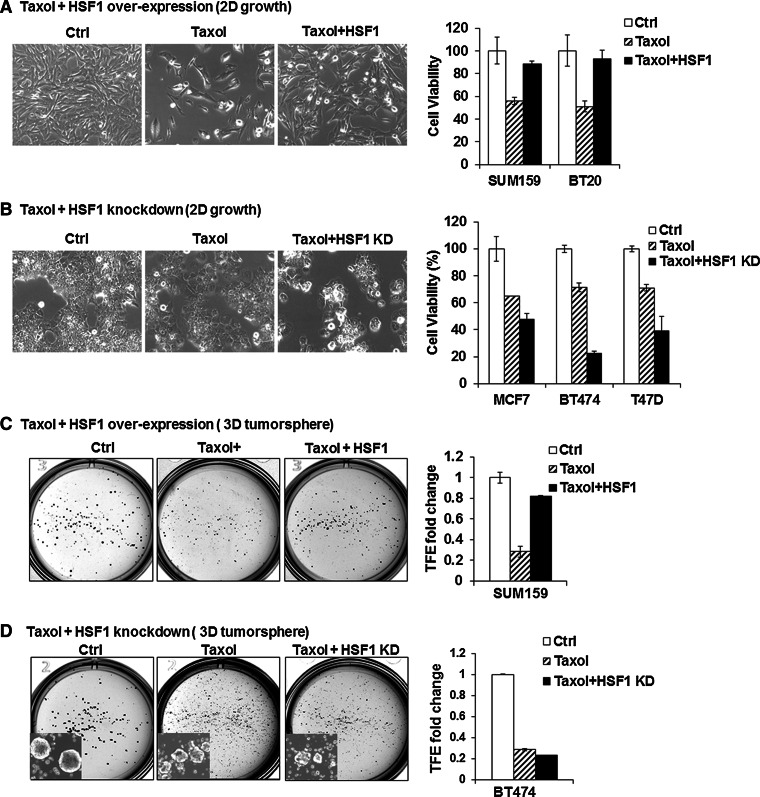
Fig. 3.
HSF1 confers drug resistance to breast cancer cells. a HSF1 over-expression increases resistance of cancer cell lines to paclitaxel (Taxol) treatment. HSF1 over-expression was induced with DOX (1 ng/ml) 2 days before drug treatment in SUM159 and BT20. The control cells were treated with vehicle only (Ctrl) or with 2.5 nM Taxol (Taxol) without HSF1 induction with DOX and compared to 2.5 nM Taxol plus HSF1 over-expression (Taxol + HSF1). Cell viability was calculated using Trypan blue exclusion method after 4 days of treatment. The bright field images provide a representative example (10× magnification) and the bar graphs show that the reduction in cell numbers observed with Taxol treatment (striped bars) is prevented with HSF1 over-expression (black bars), compared to control (white bars). Error bars show standard deviation of the mean of 3 replicates (p < 0.05). b HSF1 knockdown increases cancer cell line sensitivity to taxol treatment. HSF1 knockdown was induced with DOX (1 ng/ml) 2 days before drug treatment in MCF7, BT474, and T47D that were treated with vehicle only (Ctrl), 2.5 nM Taxol (Taxol) and 2.5 nM Taxol plus HSF1 knockdown (Taxol + HSF1-KD). Cell viability was calculated using Trypan blue exclusion method after 4 days of treatment. The bright field images provide a representative example (10× magnification) and the bar graphs show that the reduction in cell numbers observed with Taxol treatment (striped bars) is enhanced with HSF1 knockdown (black bars), compared to control (white bars). Error bars show standard deviation of the mean of 3 replicates (p < 0.05). c HSF1 over-expression increases the number of CSCs in breast cancer cell lines treated with taxol. SUM159 cell line expressing inducible HSF1 was plated into T25 flasks with or without DOX (Ctrl or HSF1) for 2 days. Next, the cells were treated with 5 nM taxol for 4 days and allowed to recover in fresh media for 3 days before tumorsphere assays. Tumorsphere formation was carried out by seeding 1 × 10⁴ cells into 6-well low adherent plates. The number of spheres was counted after 10–14 days. Tumorsphere formation efficiency (TFE) was compared between control (Ctrl, vehicle only), Taxol treated (Taxol), and Taxol treated plus HSF1 over-expression (Taxol + HSF1). The bright field images provide a representative example and the bar graphs show that the reduction in sphere numbers observed with Taxol treatment (striped bars) which is prevented with HSF1 over-expression (black bars), compared to control (white bars). Error bars show standard deviation of the mean of 3 replicates (p < 0.05). d HSF1 knockdown inhibits CSCs in breast cancer cells lines treated with taxol. Inducible HSF1 knockdown in BT474 cells was induced by adding DOX for 2 days. Cells were then treated with 5 nM for 4 days. After 3 days of recovery in drug-free medium, tumorsphere formation was carried out as described above and compared between control (Ctrl, vehicle only), taxol treated (Taxol), and Taxol treated plus HSF1 knockdown (Taxol/HSF1 KD) groups. The bright field images provide a representative example and the bar graphs show that the reduction in cell numbers observed with Taxol treatment (striped bars), which is enhanced with HSF1 knockdown (black bars), compared to control (white bars). Error bars show standard deviation of the mean of 3 replicates (p < 0.05). Insets: tumorsphere formation image taken at 4× magnification under bright light field with inverted microscopy

