
Fig. 3.
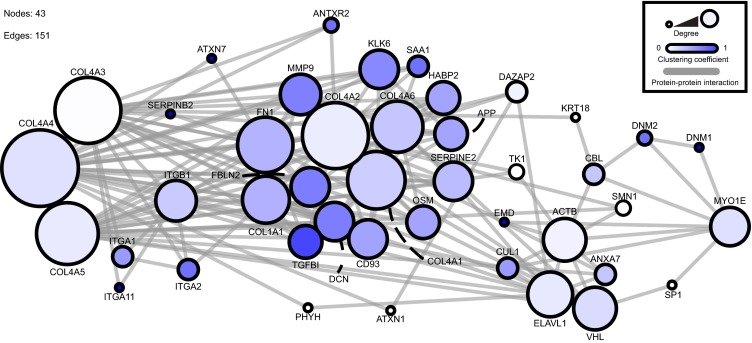
Protein–protein interaction network for collagen IV and myosin 1E. This interaction network was created from a database of known protein–protein interactions. The direct (1-hop) interactors for collagen IV-α3,4,5 and myosin 1E were identified and arranged within the network. The circles (nodes) represent proteins within the interaction network. The lines (edges) represent known interactions. The size of the node represents the degree of connections and the color of the node represents the number of interactions. The network comprises 43 nodes and 151 edges. Network analysis was performed using Cytoscape (version 2.8.1) [12]. Collagen IV alpha-3,4,5 and myosin 1E were mapped onto a merged human interactome built from the Protein Interaction Network Analysis platform Homo sapiens network (release date, 28 June 2011) and Mus musculus network (release date, 28 June 2011) [13], the ECM interactions database MatrixDB (release date, 26 August 2010) [14] and a literature-curated database of integrin-based adhesion-associated proteins [15]. Topological parameters were computed using the NetworkAnalyzer plug-in [16]