Figure 5.
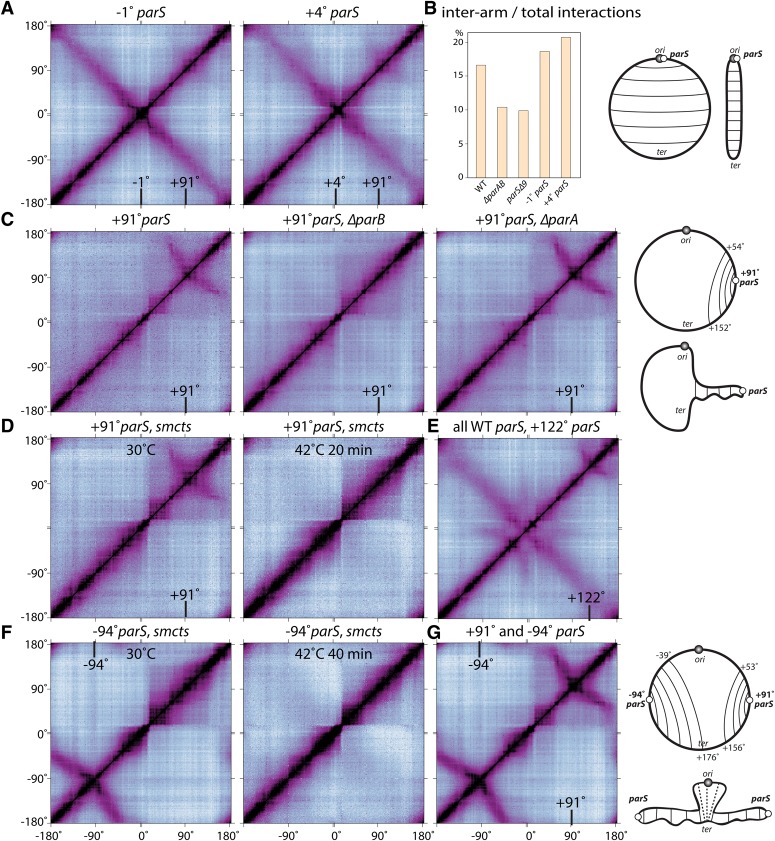
Alignment of DNA flanking parS sites. (A) Normalized Hi-C contact matrices of strains with a single origin-proximal parS site at −1° (BDR2996) or +4° (BDR2985). Both strains also contain the weak parS site at +91°. A bar graph of the percentage of interarm interactions compared with total interactions for the indicated strains is shown in B (see Supplemental Fig. S6A for details). (C) Strains harboring the endogenous parS site at +91° but lacking all eight origin-proximal parS sites (parSΔ8) in an otherwise wild-type background (BNS1657) or in cells lacking parB (BWX2761) or parA (BDR3007). (D) A strain (BWX3304) harboring the endogenous parS site at +91° and smcts grown at 30°C and shifted for 20 min to 42°C. (E) A strain (BWX3172) with an ectopic parS site inserted at +122° in an otherwise wild-type background. (F) A strain (BWX3359) harboring an ectopic parS site at −94° and smcts grown at 30°C and shifted for 40 min to 42°C. A 20-min time point was not tested. (G) A strain (BWX3231) with two parS sites inserted to +91° and −94° in parSΔ9. The positions of the relevant parS sites (in degrees) are indicated in the contact maps. Schematic representations of the long-range interactions and the disposition of the chromosome are shown at the right (see also Supplemental Fig. S8A,B).

