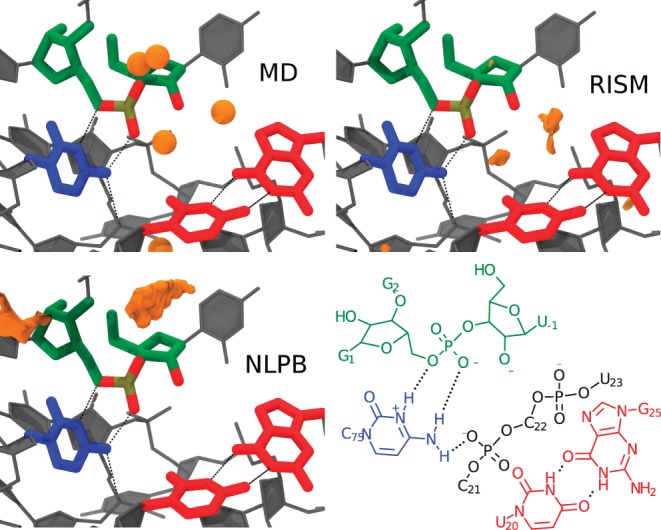
FIGURE 3.

Na+ pair distribution functions (orange isosurfaces) computed via NLPB (bottom left) and 3D-RISM-PSE3 (top right) compared with peak positions (orange spheres) from MD and volmap (top left). Isosurfaces correspond to a concentration of 300 times the bulk (140 mM). Density beyond 3 Å from the active site residues was clipped for clarity.
