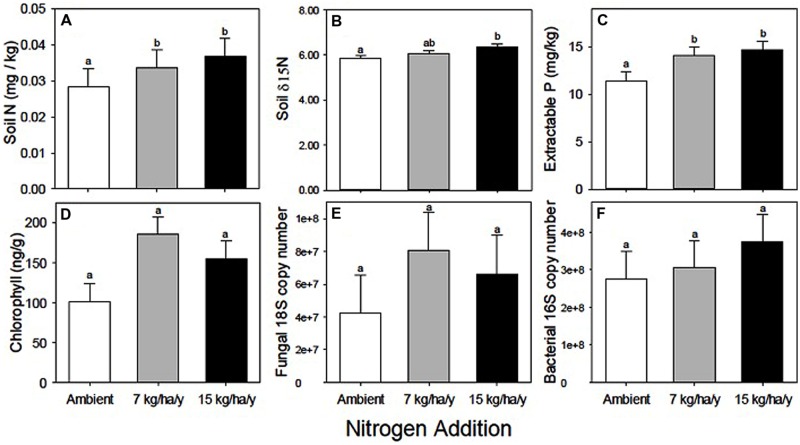
FIGURE 1.
Soil nutrient and microbial biomass responses to experimental N addition. (A) Soil N. (B) Soil δ15N. (C) Extractable P. (D) Chlorophyll a. (E) Fungal 18S copy number/g. (F) Bacterial 16S copy number/g. Different letters indicate significant differences among the N treatments. Data summarized in Table 1. Statistical results presented in Supplementary Table S2.

