
FIGURE 4.
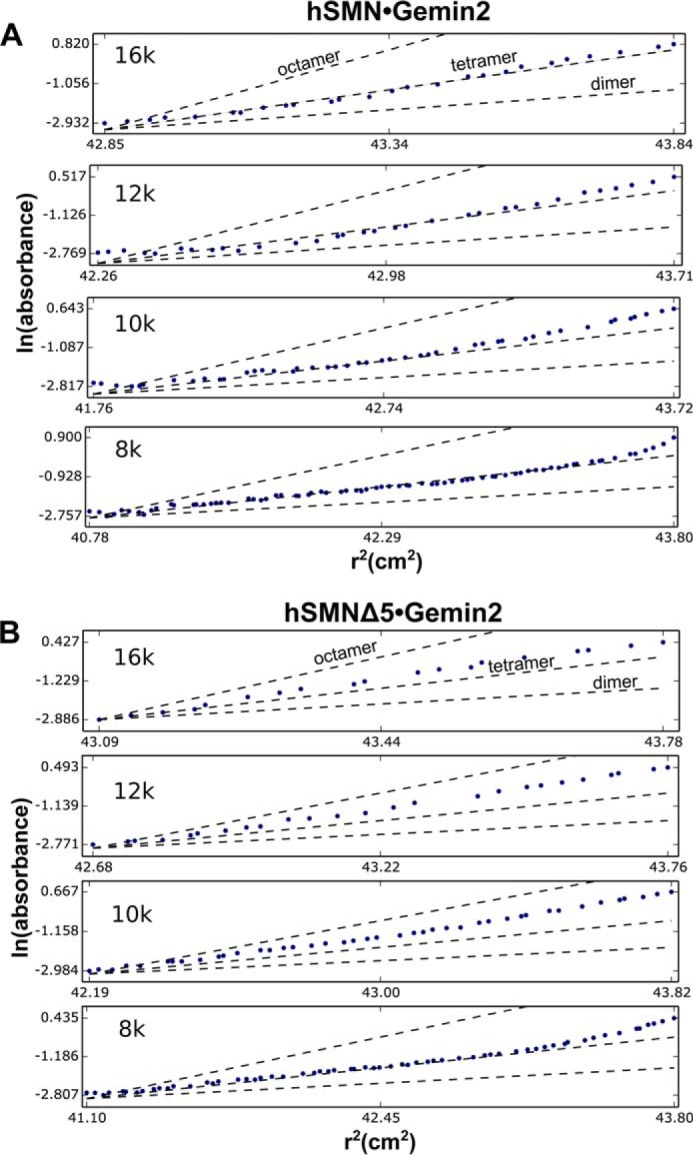
Sedimentation equilibrium analyses of hSMN·Gemin2 complexes. Linearized radial distributions are shown at four rotor speeds for hSMN·Gemin2 at 3.8 μm (A) and hSMNΔ5·Gemin2 at 3.0 μm (B). The slopes are proportional to Mw at a given value of r2. Single-species plots with calculated slopes for idealized SMN·Gemin2 dimer, tetramer, and octamer are shown for each rotor speed as dashed lines.