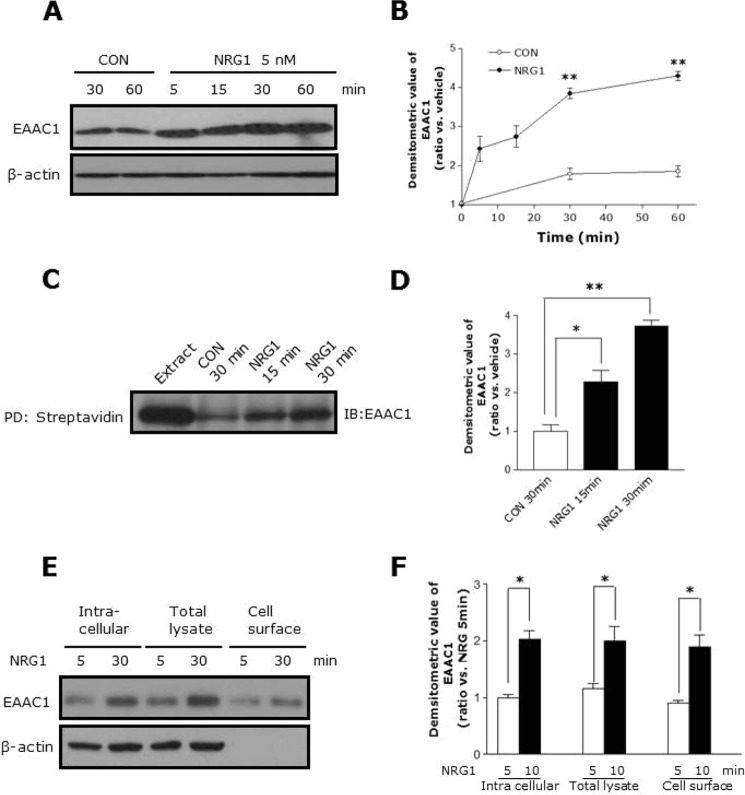
FIGURE 2.
Time course of the NRG1-induced increase in total and cell surface EAAC1. A, C6 cells were treated with 5 nm NRG1 for different periods of time. Time-dependent increases in total EAAC1 in C6 cell lysates. B, statistical analysis of the expression of total EAAC1 in a time-dependent manner. n = 8. **, p < 0.01. C, cell surface expression of EAAC1 was measured by biotinylation followed by batch extraction and analysis by Western blot. D, statistical analysis of expression of surface EAAC1 in the time-dependent manner. n = 8. *, p < 0.05; **, p < 0.01. E, representative Western blot probed with EAAC1 and actin antibodies demonstrating the effect of NRG1 on intracellular, total lysate, and cell surface expression of EAAC1 in C6 cells. F, bar graph summarizes the data in E. n = 8. *, p < 0.05.

