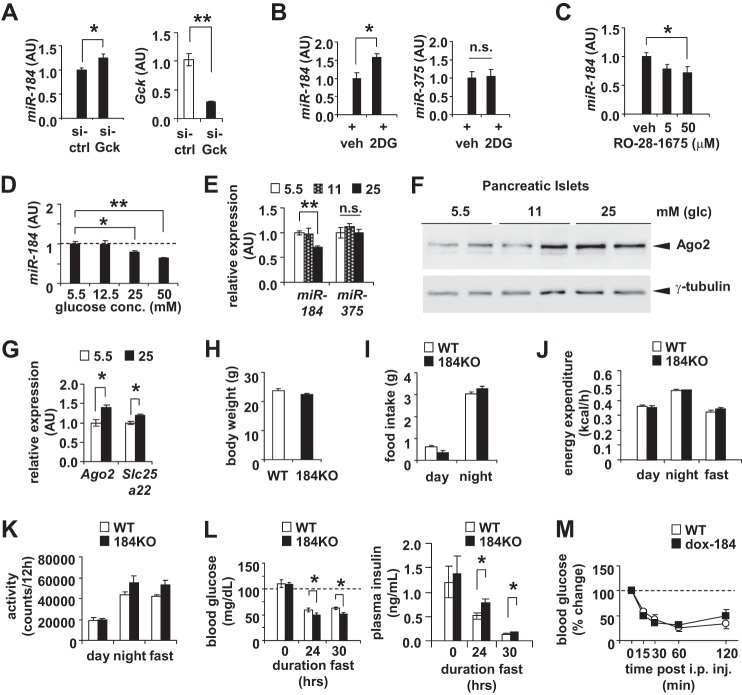
FIGURE 2.
miR-184 and Ago2 remain inversely correlated according to glucose metabolism. A, qRT-PCR analysis of miR-184 in MIN6 cells transfected with either 200 pmol of siRNA targeting glucokinase (si-Gck) or scrambled control (si-Ctrl) for 48 h. AU, arbitrary units. B, qRT-PCR analysis of miR-184 and miR-375 in MIN6 cells after treatment with 2-deoxyglucose (2DG) or vehicle control (veh) for 48 h. C, qRT-PCR analysis of miR-184 in MIN6 cells after receiving 5 or 50 μm glucokinase activator (RO-28–1675) or vehicle control (veh) for 48 h. D, qRT-PCR analysis of miR-184 in MIN6 cells after treatment of 5.5, 12.5, 25, and 50 mm of glucose for 48 h (n = 4 for all concentrations). E, qRT-PCR analysis of miR-184 and miR-375 in isolated islets of 10-week-old WT mice that were treated ex vivo with either 5.5, 11, or 25 mm glucose (n = 4). n.s., not significant. F, Western blotting analysis of Ago2 in the isolated islets of 10-week-old WT mice that were treated ex vivo with 5.5, 11, or 25 mm glucose. G, qRT-PCR analysis of Ago2 and Slc25a22 in isolated islets treated ex vivo with either 5.5 or 25 mm glucose (n = 4). H, body weight measurements of 10-week-old 184KO mice compared with their WT littermate controls (n = 4). I, food intake measurements of 10-week-old 184KO mice compared with their WT littermate controls during day and night (n = 4). J, energy expenditure measurements of 10-week-old 184KO mice compared with their WT littermate controls during the day and night (n = 4). K, activity measurements of 10-week-old 184KO mice compared with their WT littermate controls during the day and night (n = 4). L, fasted blood glucose and plasma insulin levels of 10-week-old 184KO mice compared with their littermate controls (n = 4–6). M, blood glucose levels during an insulin tolerance test (ITT) from 8-week-old WT and dox-184 mice (n = 3–4). Results presented as mean ± S.E. *, p < 0.05; **, p < 0.01; ***, p < 0.001.

