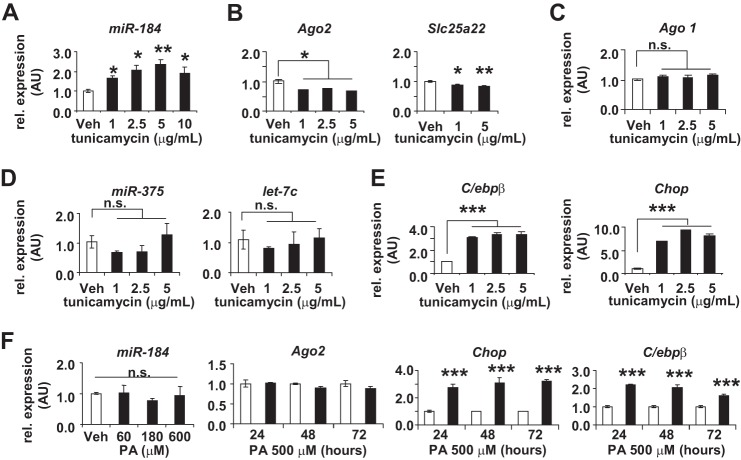
FIGURE 3.
miR-184 is regulated upon inhibition of glucose metabolism by tunicamycin. qRT-PCR analysis of miR-184 (A) Ago2 and Slc25a22 (B), Ago1 (C), miR-375 and let-7c (D), and C/ebpβ and Chop (E) mRNA expression in MIN6 cells treated with increasing concentrations of tunicamycin for 48 h (n = 4 for each concentration). AU, arbitrary units; Veh, vehicle. n.s., not significant. F, qRT-PCR analysis of miR-184 in MIN6 cells treated with increasing concentrations of palmitic acid (PA) for 48 h and the levels of Ago2, C/ebpβ, and Chop expression measured after treating MIN6 cells with 500 μm PA over time (n = 4 for each concentration and time point). Results are presented as the mean ± S.E. *, p < 0.05; **, p < 0.01; ***, p < 0.001.

