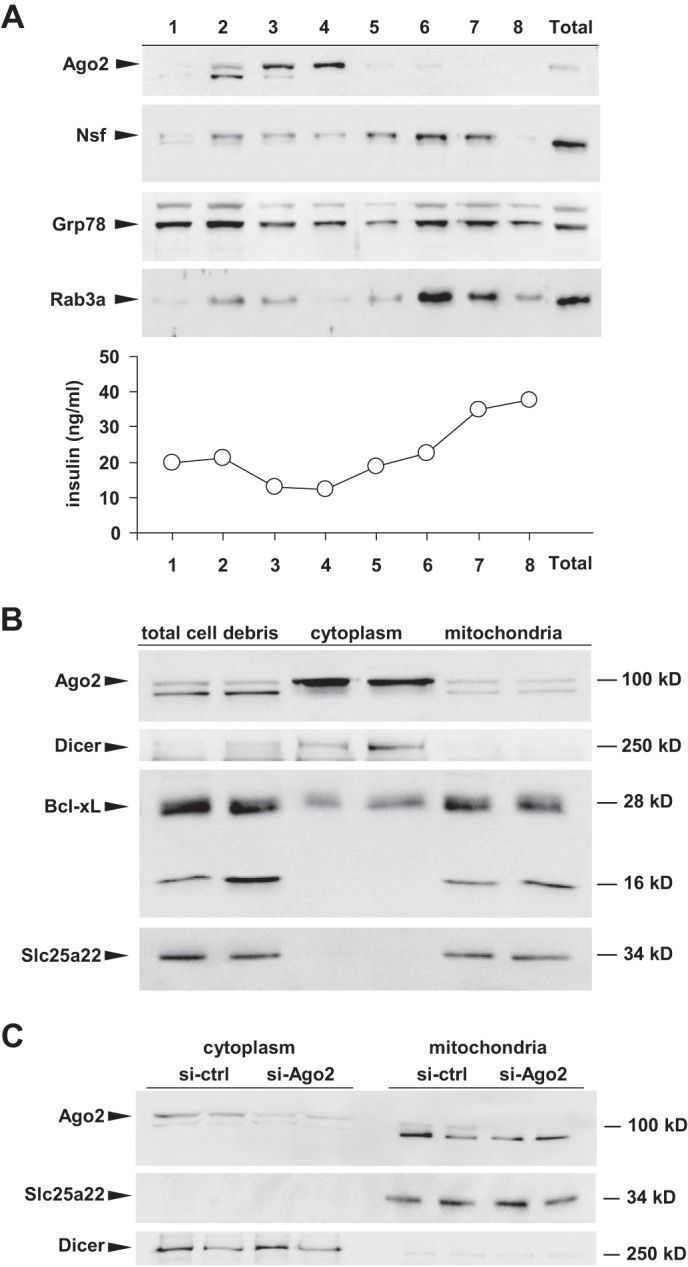
FIGURE 6.

Localization of Ago2 at the mitochondria in MIN6 cells. A, Western blotting analysis and insulin quantification by radioimmunoassay of the fractions derived from a discontinuous sucrose gradient of MIN6 cells. B, Western blotting analysis of cytoplasmic and mitochondrial fractions for Ago2, Bcl-xL, Dicer, and Slc25a22. C, Western blotting analysis of cytoplasmic and purified mitochondria for Ago2, Dicer, and Slc25a22 after si-RNA mediated knockdown of Ago2 in MIN6 cells.
