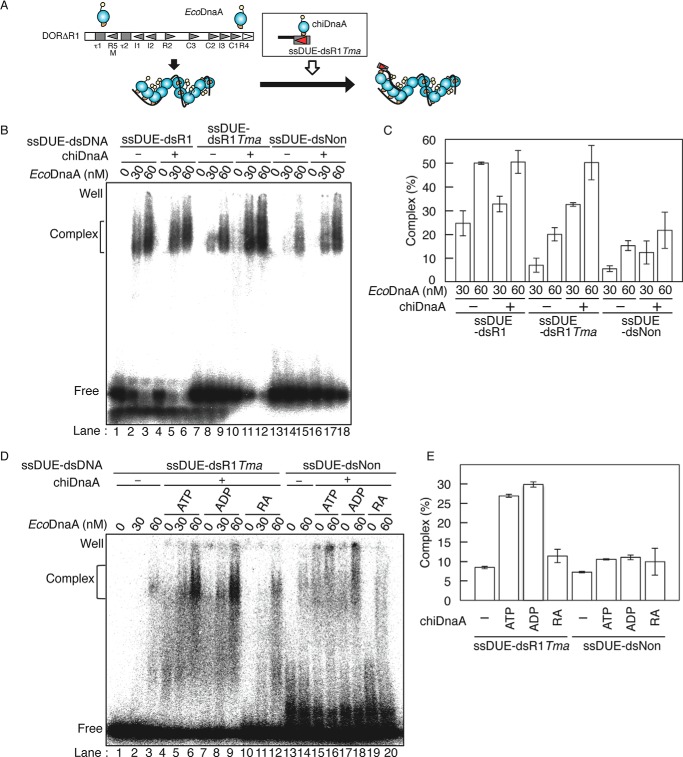
FIGURE 4.
Role of the Arg finger of the R1 box-bound DnaA in ssDUE binding. A, schematic of ssDUE recruitment assay. [32P]ssDUE ligated to dsDNA bearing the DnaA box is incubated with DnaA, followed by further incubation in the presence of ATP-EcoDnaA oligomers complexed with DORΔR1. Resultant complexes are analyzed by EMSA. DnaA domains and oriC sequences are illustrated as in Fig. 1. B and C, ssDUE recruitment assay using EcoDnaA and chiDnaA. In the first stage, ATP-chiDnaA (100 nm) was incubated on ice for 5 min with [32P]ssDUE ligated to dsDNA bearing the R1 box (ssDUE-dsR1), TmaDnaA box (ssDUE-dsR1Tma), or nonsense sequence (ssDUE-dsNon) (12.5 nm). In the second stage, one-fifth portions of these mixtures were incubated at 30 °C for 5 min in buffer containing DORΔR1 (5 nm) and the indicated amounts of ATP-EcoDnaA. EMSA was performed using 4% PAGE and BAS2500 image analysis (B). The amounts of ssDUE-dsDNA complexed with EcoDnaA-DORΔR1 were quantified, and the levels relative to the input ssDUE-dsDNA are shown as Complex (%) (C). Two independent experiments were done, and both data and mean values are shown. D and E, ssDUE recruitment assay using chiDnaA R285A. In the first stage, ATP-chiDnaA (ATP), ADP-chiDnaA (ADP), or ATP-chiDnaA R285A (RA) (100 nm) was incubated on ice for 5 min with ssDUE-dsR1Tma or ssDUE-dsNon (12.5 nm). In the second stage, one-fifth portions of these mixtures were incubated with DORΔR1 and ATP-EcoDnaA as described above, followed by EMSA using 4% PAGE and BAS2500 image analysis (D). The amounts of ssDUE-dsDNA complexed with EcoDnaA-DORΔR1 at 60 nm EcoDnaA were quantified, and the levels relative to the input ssDUE-dsDNA were shown as Complex (%) (E). Two independent experiments were done, and both data and mean values are shown.

