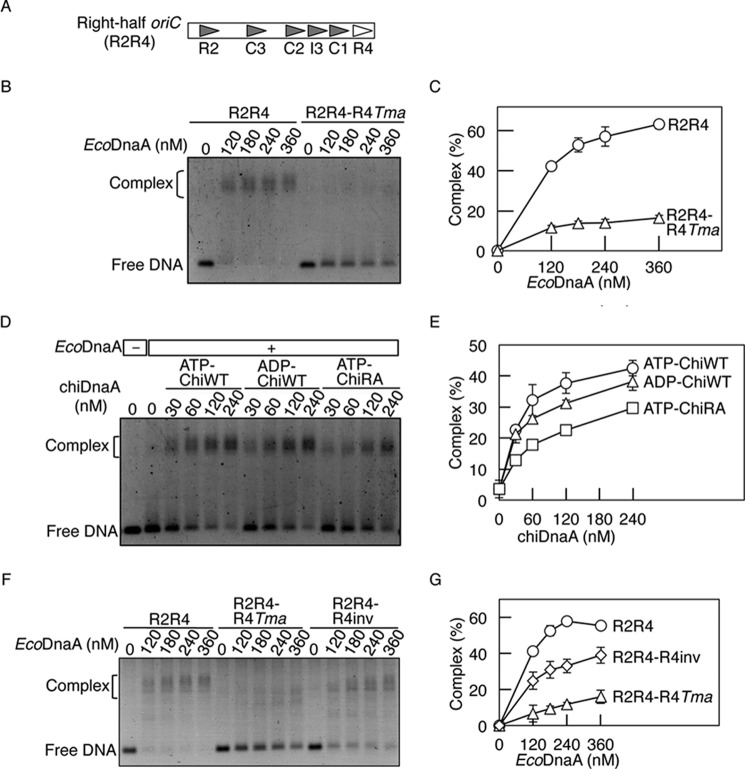
FIGURE 6.
Role for the Arg finger of the R4 box-bound DnaA in DnaA assembly. A, structure of the right-half oriC. Symbols are as described in the legend to Fig. 1A. B and C, EMSA using EcoDnaA. The indicated amounts of ATP-EcoDnaA were incubated at 30 °C for 10 min with the right-half oriC (35 nm) bearing the wild-type sequence (R2R4) or the R4 box replaced with the TmaDnaA box sequence (R2R4-R4Tma). EMSA was performed using 2% agarose gel and GelStar staining. A representative gel image is shown in a black-white inverted mode (B). The amounts of DnaA-DNA complex relative to the total DNA were quantified and used as a measure of complex formation (%) (C). Two independent experiments were done, and both data and mean values are shown. D and E, EMSA using EcoDnaA and chiDnaA. ATP-EcoDnaA (80 nm) was incubated in buffer containing R2R4-R4Tma (35 nm). The indicated amounts of ATP-chiDnaA (ATP-ChiWT), ADP-chiDnaA (ADP-ChiWT), or ATP-chiDnaA R285A (ATP-ChiRA) were added, and reactions were incubated at 30 °C for 10 min. EMSA was performed as described above (D). The relative amounts of DnaA-DNA complexes were quantified. Error bars, S.D. from three independent experiments (E). F and G, EMSA using the right-half oriC fragments. The indicated amounts of ATP-EcoDnaA were incubated at 30 °C for 10 min with the right-half oriC (35 nm) bearing the wild-type sequence (R2R4), the R4 box replaced with the TmaDnaA box sequence (R2R4-R4Tma), or the inverted R4 box (R2R4-R4inv). EMSA was performed as described above (F). The relative amounts of DnaA-DNA complexes were quantified. Error bars, S.D. from three independent experiments (G).

