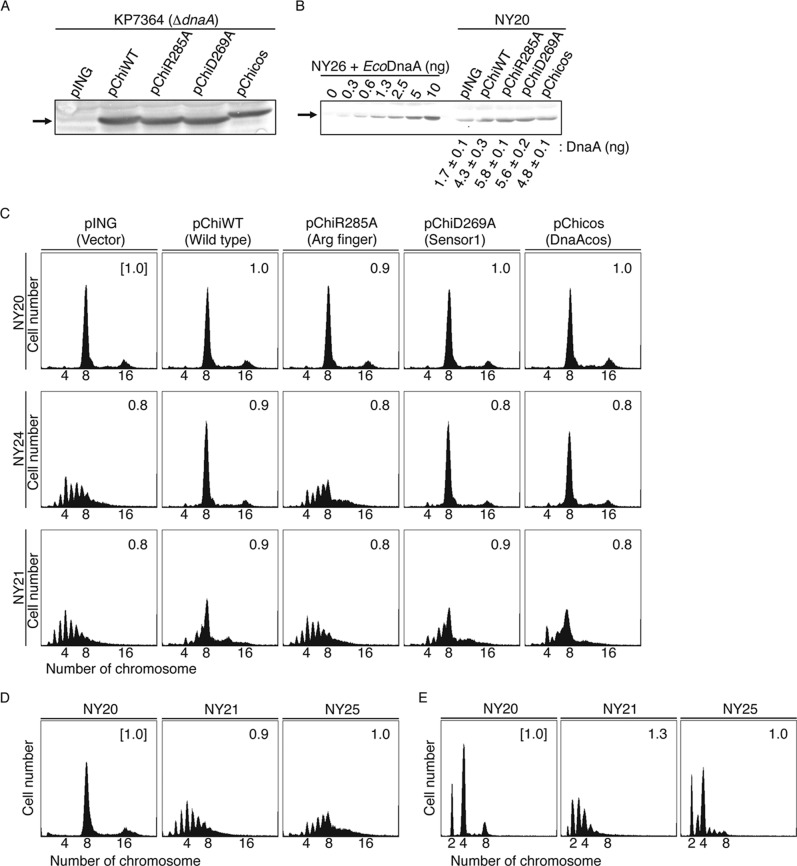
FIGURE 7.
Role for the Arg finger of DnaA bound to the R1 and R4 boxes in initiation in vivo. A and B, amounts of cellular chiDnaA were determined by Western blotting. Cells of strain KP7364 (ΔdnaA::spec rnhA::kan) (A) or NY20 (B) carrying the indicated plasmid were grown in LB medium at 37 °C to an absorbance (A660) of 0.1. A portion (500 μl) of each culture was analyzed by Western blotting using anti-EcoDnaA antibody as described previously (26). Arrows, bands corresponding to chiDnaA or to a mixture of chiDnaA and EcoDnaA. For a quantitative standard, the indicated amounts of purified EcoDnaA were mixed with whole cell extract of NY26 (ΔdnaA::spec rnhA::kan). The amounts of cellular DnaA were quantified in two independent experiments. Disruption of rnhA activates alternative origins independent of DnaA (49). chiDnaA has a molecular mass similar to EcoDnaA. C, in vivo analysis of R1 and R4 box-bound DnaA. Cells of strains NY20 (wild-type oriC; WT), NY24 (chromosomal R1 box substituted with TmaDnaA box; R1Tma), and NY21 (chromosomal R4 box substituted with TmaDnaA box; R4Tma) carrying pING (vector), pChiWT (chiDnaA), pChiR285A (chiDnaA R285A), or pChiD269A (chiDnaA R269A) were grown at 37 °C in LB medium containing ampicillin. When the absorbance A660 reached 0.1, culture portions were withdrawn and used for quantification of cell size (cell mass) using flow cytometry. Additional culture portions were further incubated for 4 h in the presence of rifampicin and cephalexin. DNA contents were quantified using flow cytometry. Equivalent chromosome numbers are shown. Cell mass relative to that of NY20 cells bearing pING1 (1.0) is indicated at the top right of each panel. Two independent experiments were performed, and indistinguishable results were exhibited. D, in vivo analysis of cells bearing the inverted R4 box. Cells of strains NY20, NY21, and NY25 (chromosomal R4 box inversion; R4inv) were grown and analyzed using flow cytometry as described above. Cell mass relative to that of NY20 cells (1.0) is indicated at the top right of each panel. For NY25, cells from three independent transductants were analyzed, and similar results were obtained for each; representative data are shown. E, analysis of NY20, NY21, and NY25 cells grown in a minimum medium. Flow cytometry analysis was performed as described above except that minimum medium described previously (18) was used. For NY25 cells, three independent transductants were analyzed, and similar results were obtained for each; representative data are shown.

