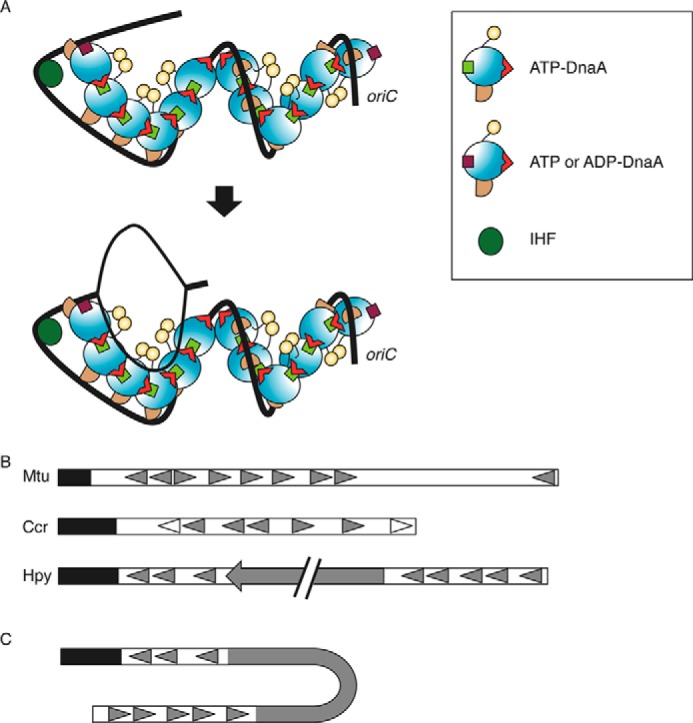
FIGURE 8.

Model of initiation complex structure. A, DnaA domains I–IV are distinguished using different colors as in Fig. 1D. DnaA, IHF (dark green circle), and oriC (black line) are illustrated according to the AF-inward model (Fig. 1D). The position of the Arg finger in domain III is indicated with a red triangle. DnaA bound to the R1 and R4 binds ATP or ADP (brown square), whereas other DnaA molecules bound ATP (light green square). IHF bent oriC and promoted interaction between DnaA bound at the R1 box and the adjacent molecule (top). This led to unwinding of DUE and recruitment of the resultant ssDUE to a DnaA subcomplex formed on a low affinity box cluster of the left-half oriC (bottom). The two DnaA subcomplexes are oriented in opposite directions, and each would be expected to bind a single DnaB helicase. B, schematic presentation of the basic structure of oriC. Mtu, M. tuberculosis; Ccr, C. crescentus; Hpy, H. pylori. The DUE region is indicated by a black bar. DnaA boxes are indicated by filled or open triangles. In C. crescentus, the DnaA boxes indicated by open triangles have higher affinity for DnaA than others indicated by filled triangles. A filled arrow in H. pylori oriC indicates the dnaA gene. C, a model proposed for an initiation complex in H. pylori. When H. pylori DnaA is complexed with the cognate oriC, the oriC1-DnaA subcomplex might interact with the oriC2-DnaA subcomplex, depending on DNA bending in the dnaA gene region (62). DnaA protein is omitted in this figure for simplicity.
